Take a closer look into the record high year for Australia’s agricultural exports
Explore our trade performance deep dives
National trade summary
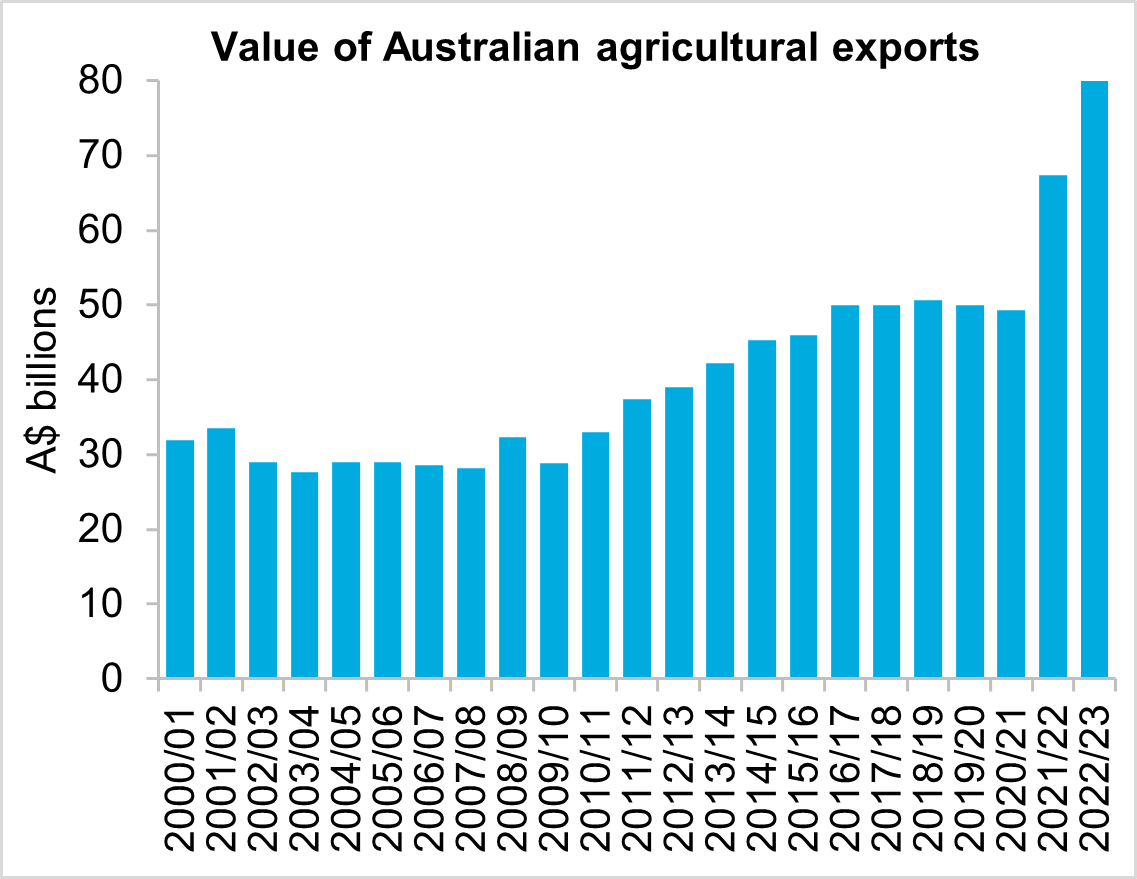
Australian agricultural exports achieved a new record high value in 2022/23, building upon a strong rise in the prior year. In 2022/23, the value of agricultural exports reached $79.9 billion, a rise of $12.5 billion (+18.6 per cent) from the year before. This added to a rise of $18 billion (+36.6 per cent) in 2021/22. Export value was 49.4 per cent above the five-year average.
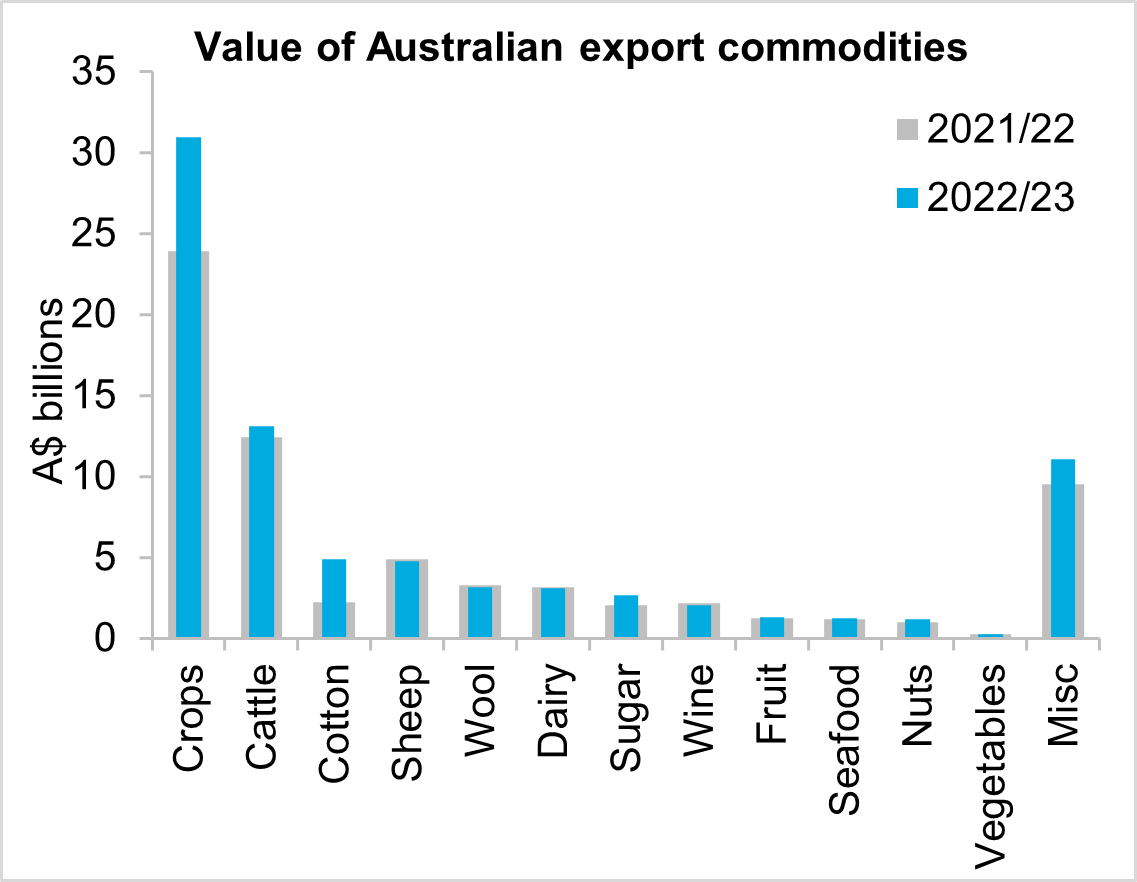
Growth in export value was primarily driven by rises in the value of broadacre crops and cotton. Broadacre crops added a further $7.1 billion (+19.6 per cent) in export value in 2022/23, rising to $31 billion. This was more than double their value in 2020/21. Consecutive years of record-setting crop production and high commodity prices drove this extraordinary level of export value in 2022/23. Exports in 2022/23 include volumes from the winter crop grown in 2021, a record at the time, and the subsequent record crop grown in 2022. Adding to this was a rise in cotton exports which more than doubled in value to $4.9 billion, up $2.7 billion from the year before. Increased beef production helped drive a rise of $726 million (+5.9 per cent) in the value of cattle industry exports. Sugar was another strong growth commodity, adding a further $650 million (+32.1 per cent) in 2022/23 on top of the strong rise recorded in 2021/22. These gains more than offset a drop in the value of wine exports (-7.5 per cent) and smaller declines of three per cent or less for dairy, wool, sheep and vegetables.
The value of Australian agricultural exports in 2023/24 is forecast to fall below the record setting levels seen in the past two years, but still be the third most valuable year on record. This decline is primarily due to a reduction in crop production. Current estimates are for a 34 per cent decline in winter crop production compared to last season. In addition to reduced crop volumes, lower prices for many commodities will weigh on the value of exports. Livestock products including red meat, wool and dairy are all experiencing lower commodity prices in recent months. Although production levels of red meat are set to rise in 2023/24, lower prices will likely limit growth in export value. Challenging economic conditions for consumers in key markets are weighing on prices for exports and are not expected to improve in the near-term. Appetite for Australian products may be supported by a lower Australian dollar.
Source: Global Trade Atlas (GTA)
Source: Global Trade Atlas (GTA)
State export performance
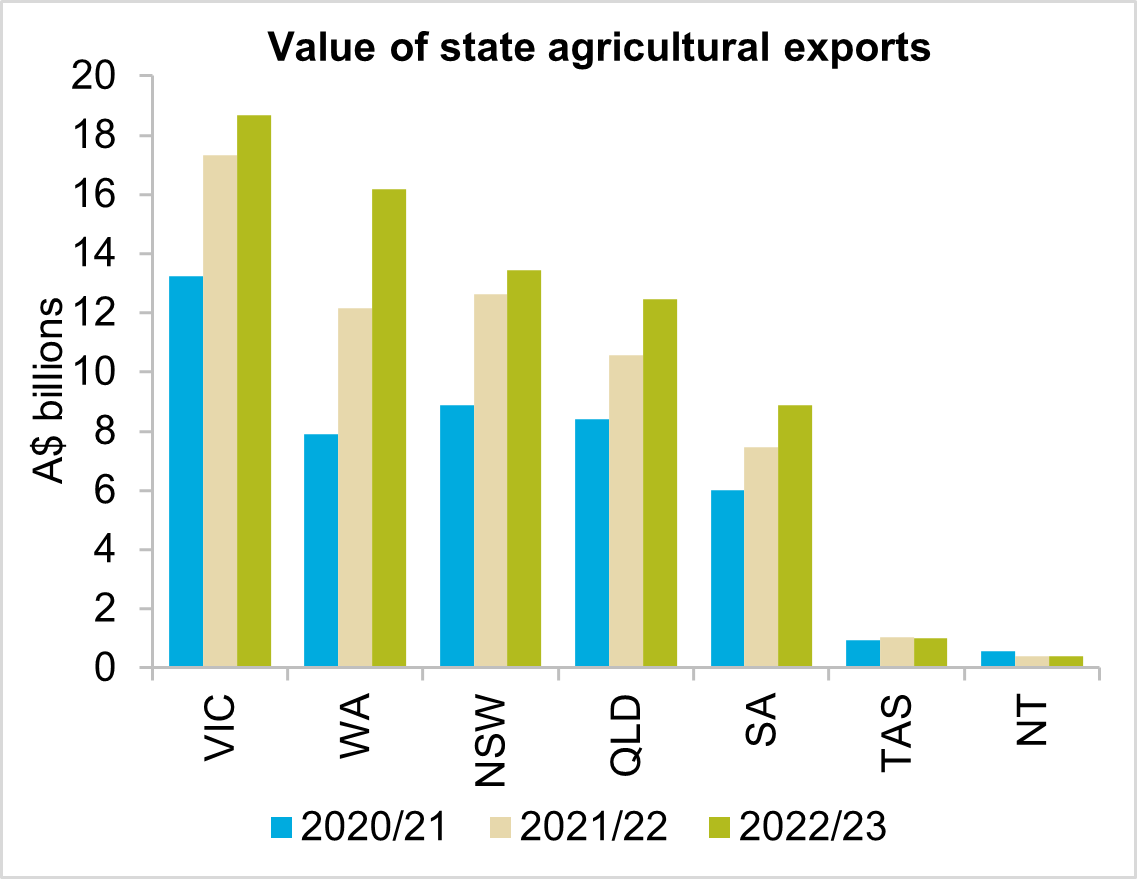
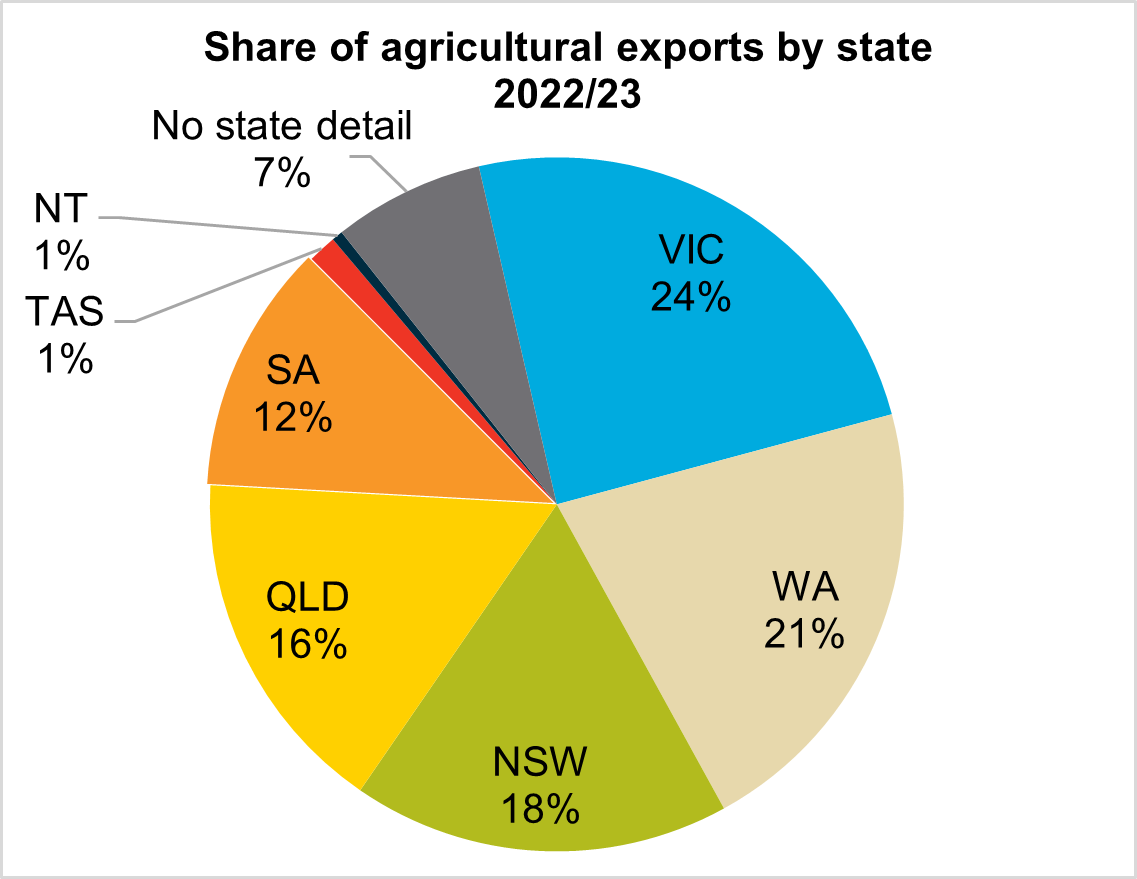
All states except Tasmania and the Northern Territory saw an increase in the value of agricultural exports in 2022/23. Western Australia had the largest year-on-year increase, jumping 33.2 per cent to $16.2 billion. This followed a 53.9 per cent increase in the previous year. The rapid rise of Western Australian exports saw the state to reclaim its position as the second largest exporter behind Victoria. Western Australian exports exceeded New South Wales for the first time since 2018/19. Western Australia’s rise in export value is on the back of good seasonal conditions for cropping. Crop exports accounted for 75.4 per cent of the value of Western Australia's agricultural exports in 2022/23.
Favourable cropping conditions also supported export growth in Victoria, New South Wales, Queensland, and South Australia. All four of these states had strong export growth in 2022/23, and as a result, their exports were all 30 per cent or more above the five-year average. Victoria maintained its position as the number one exporter in 2022/23 with growth of 7.7 per cent taking it to $18.7 billion. Victorian agricultural exports increased due strong growth in crop, horticulture, and cattle industry exports. New South Wales was the third largest exporting state with export value of $13.4 billion, up 6.6 per cent year-on-year. Queensland saw relatively stronger growth of 17.8 per cent, taking its export value to $12.5 billion. Likewise, South Australia saw strong growth of 19.4 per cent, rising to a value of $8.9 billion.
Tasmania saw a 1.6 per cent drop in export value in 2022/23, falling to just over $1 billion. A lower value of dairy export was the primary driver of this fall. Dairy exports fell 25.8 per cent in 2022/23, however, remained well above the long-term average value. Tasmanian export value did find support from seafood exports, which increased by 13 per cent in 2022/23.
The value of the Northern Territory’s exports dropped five per cent in 2022/23 to its lowest level since 2013/14 at $392.5 million. The main driver of the Northern Territory’s decline was a 13.5 per cent reduction in cattle export value. Cattle exports generally account for around 95 per cent of the Territory's agricultural exports.
Source: Global Trade Atlas (GTA)
Source: Global Trade Atlas (GTA)
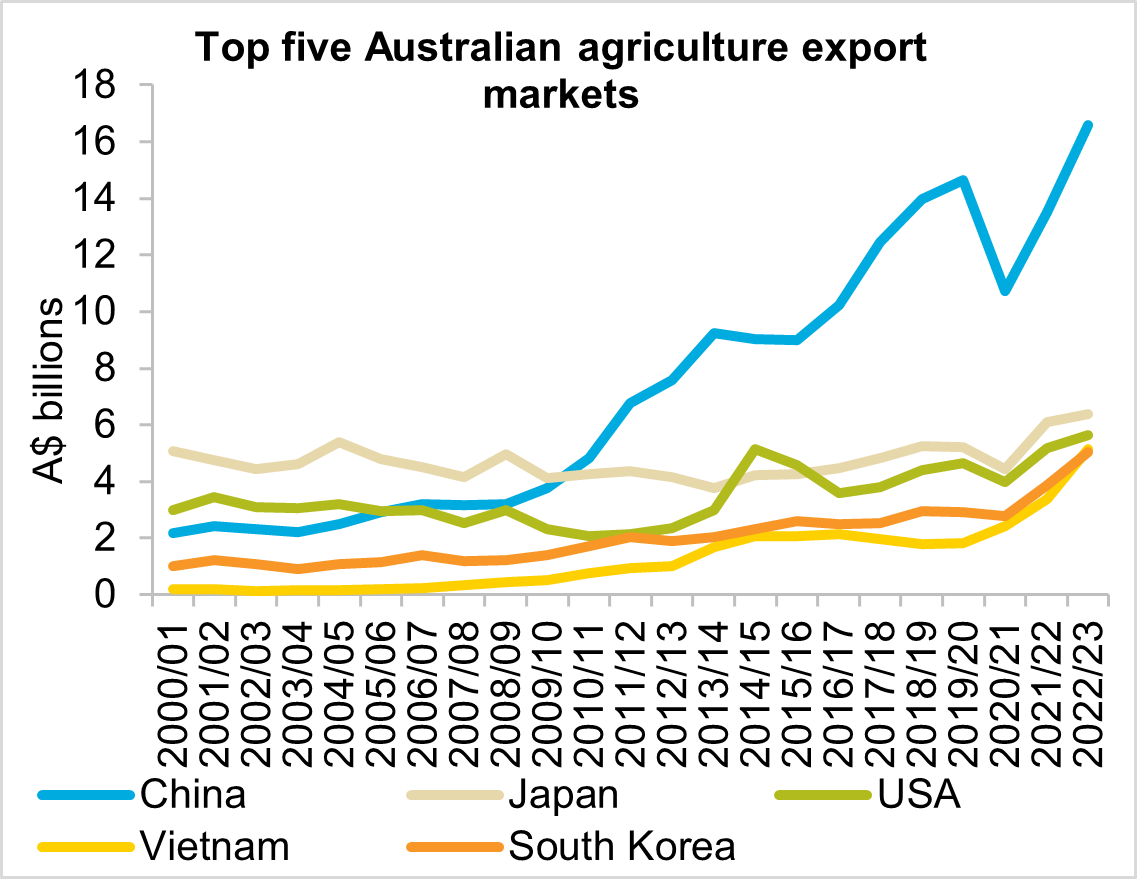
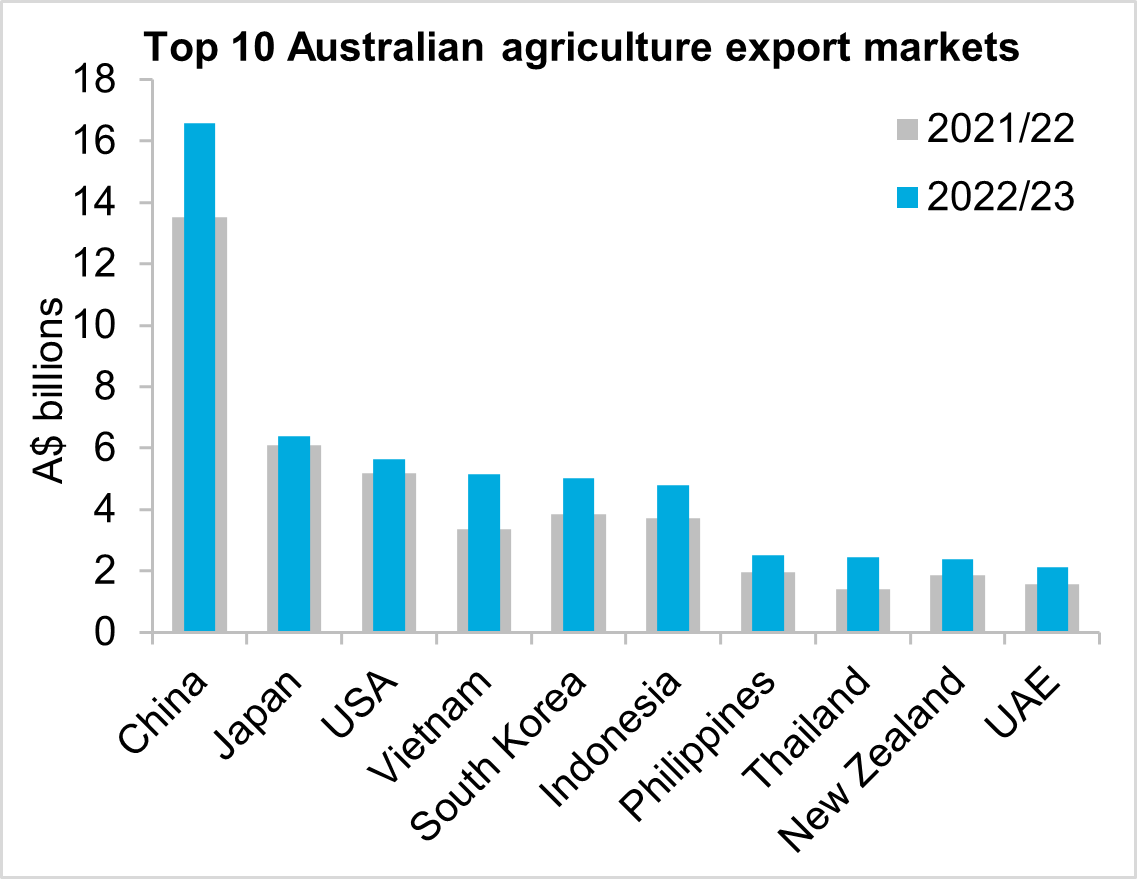
Export markets
Growth was a consistent story across Australian agriculture’s major export markets in 2022/23. The top 13 markets all recorded year-on-year growth and the top 12 markets all achieved record highs.
China was the largest growth market in dollar terms for the second year in a row. The value of exports to China rose $3.1 billion (+22.7 per cent) in 2022/23 to a record high of $16.6 billion. Over the past two financial years, exports to China have grown by $5.9 billion (+54.7 per cent) following a sharp decline in 2020/21. Growth to China in 2022/23 was led by an increase in wheat exports of $1.5 billion (+66 per cent). Beef, almonds and cotton also saw growth. Despite the strong rise, China’s share of total export value only rose moderately from 20.1 per cent in 2021/22 to 20.8 per cent in 2022/23. This remains below the five-year average of 24.7 per cent and a peak of 29.3 per cent from 2019/20.
The substantial increase in the value of wheat exports helped drive growth of over $1 billion or more across four other markets: Vietnam, South Korea, Indonesia and Thailand. Vietnam saw the largest growth of these markets with a rise of $1.8 billion (+53.5 per cent) thanks to strong growth in both cotton and wheat exports.
Japan and the US retained their places as Australian agriculture’s second and third most valuable markets but both saw modest growth of less than 10 per cent. Export value to Japan rose only $283 million (+4.6 per cent) to $2.2 billion as growth in crop exports was diluted by reduced beef export value. Conversely, the US saw an increase in beef export value but declines in the value of sheepmeat and wine exports saw growth of just $451 million (+8.7 per cent) to $5.6 billion in 2022/23.
Australian agriculture did not see any further diversification of export markets in 2022/23 but held onto the gains made in the previous two years. The top five markets accounted for 48.6 per cent of value in 2022/23, up from 48.1 per cent in 2021/22 but down on the five-year average of 53.2 per cent. Another measure of diversification is the share of value to top 10 markets, excluding China. This group of markets accounted for 45.6 per cent of value in 2022/23, up from 43.5 per cent in 2021/22 and above the five-year average of 43.3 per cent. This suggests that while the reliance on China has lessened in recent years, there has not been much diversification outside of the other major markets.
Source: Global Trade Atlas (GTA)
Source: Global Trade Atlas (GTA)
Commodity performance
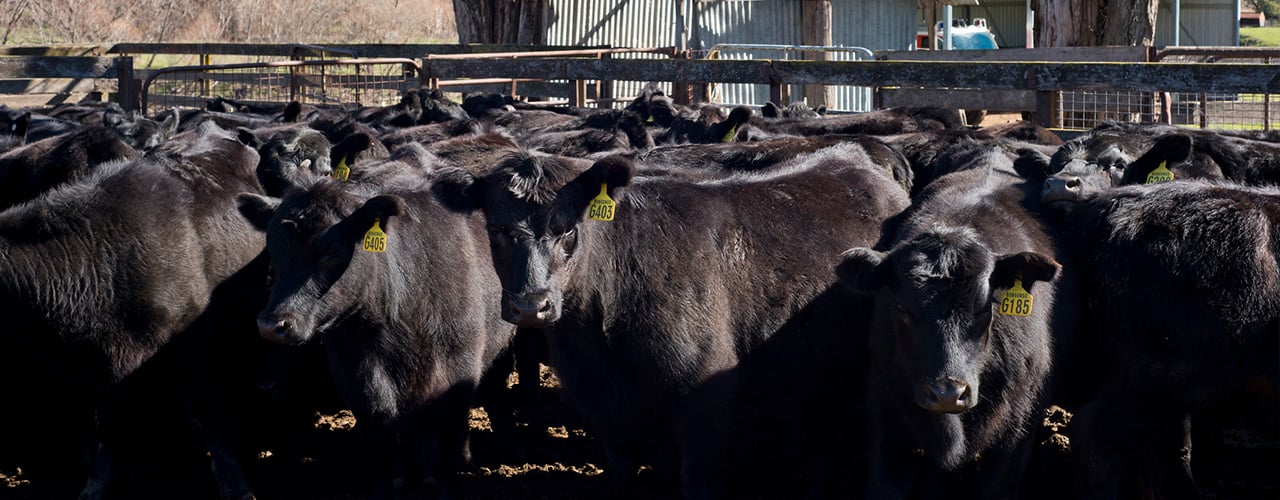
Cattle exports 2022/23
The value of Australian cattle industry exports increased in 2022/23 due to rising domestic production and improved demand from key export markets.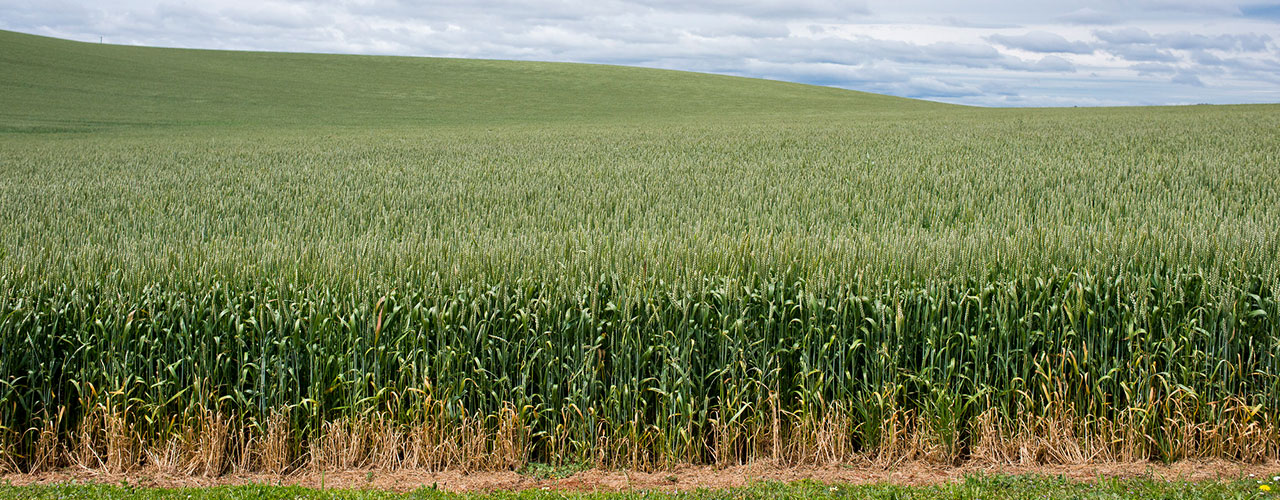
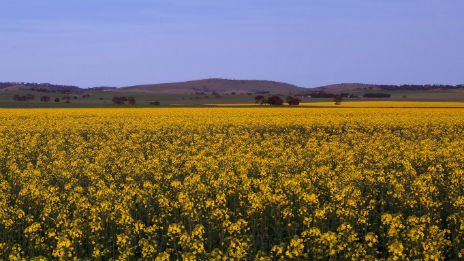
Cropping exports 2022/23
The value of Australian cropping exports increased for the fourth consecutive year in 2022/23.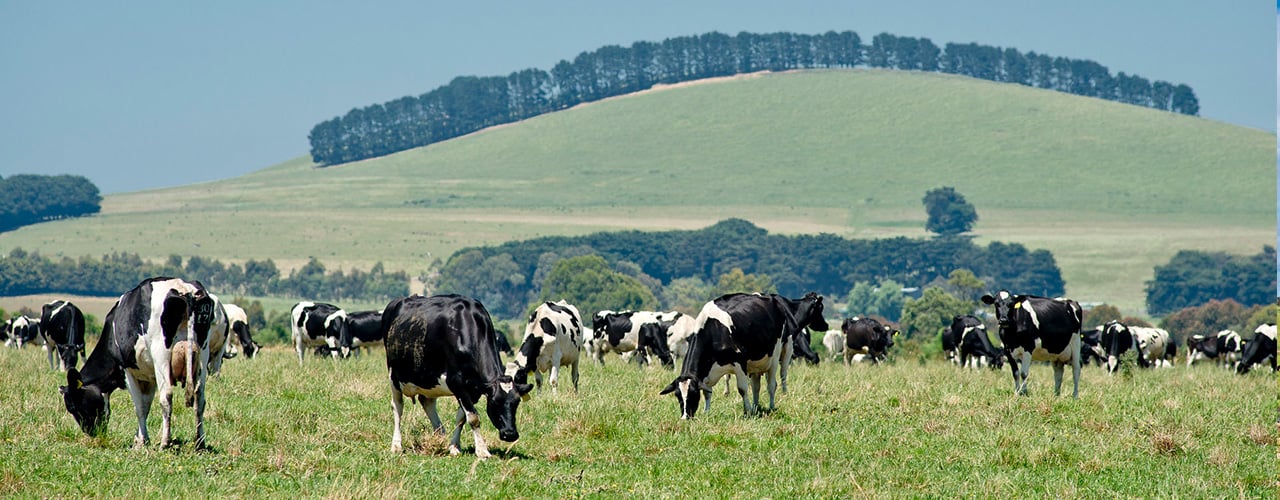
Dairy exports 2022/23
Australian dairy exports in 2022/23 totalled $3.07 billion. This was a 3.0 per cent decline on last season's record of $3.17 billion.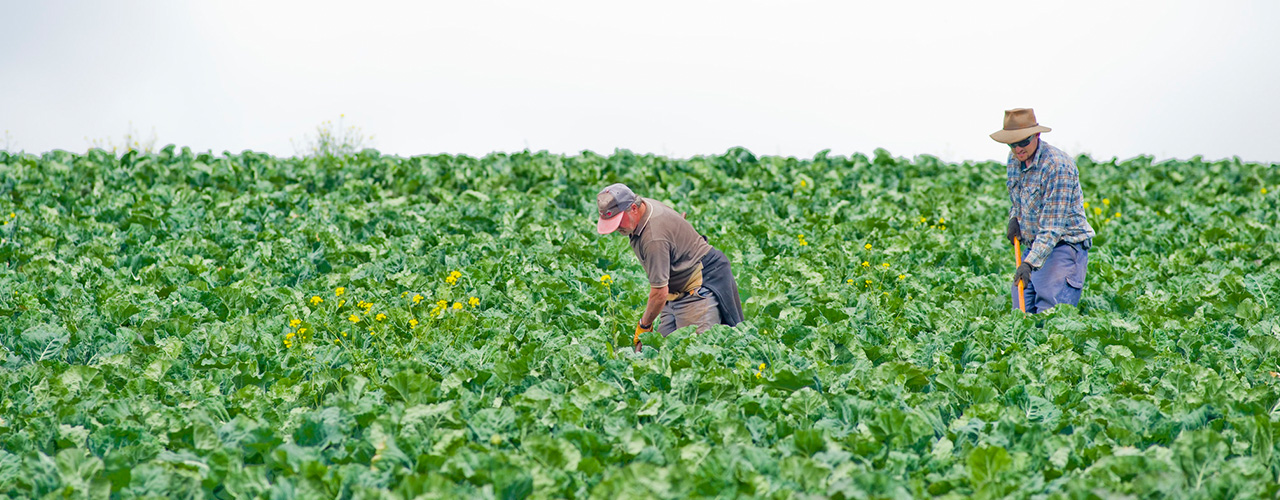
Horticulture exports 2022/23
The value of Australian horticultural exports rose to their second highest level in 2022/23.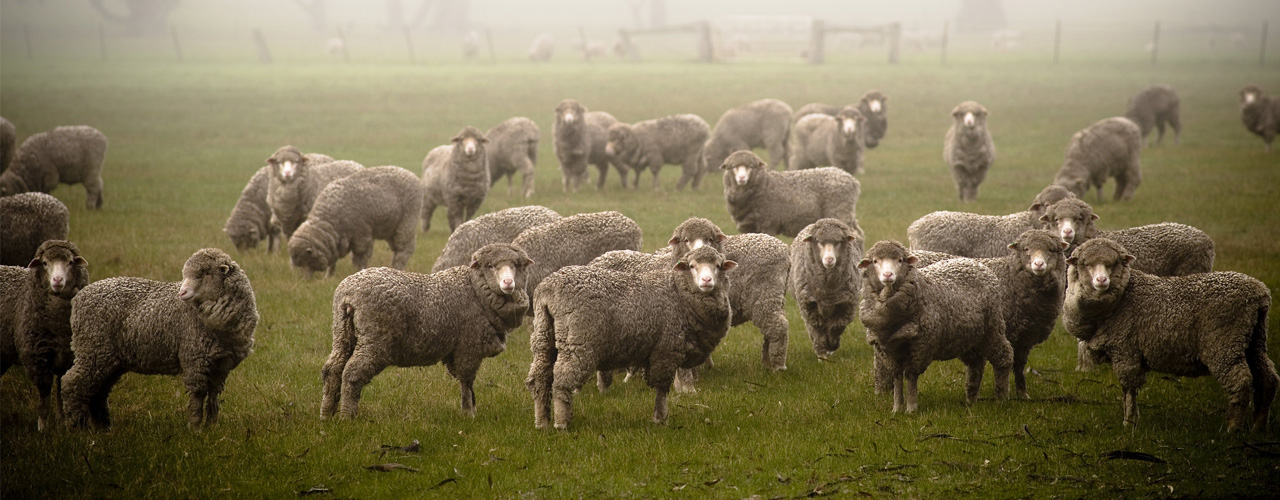
Sheep exports 2022/23
The value of Australian sheep industry exports decreased in 2022/23 as increased production was not able to account for the reduction in prices.
Wool exports 2022/23
Increased wool production was offset by lower prices which drove a small decrease in the value of Australian wool exports in 2022/23.
Want more information?
Rural Bank recognises the importance of relevant information to enable sound business decision-making. To view our other reports please visit our Publications page. You can also receive reports direct to your email by subscribing to Rural Bank Insights.
You may also be interested in
Farm Management Deposit
A Rural Bank Farm Management Deposit lets you set money aside for when you need it most.
Term Deposit
Watch your savings grow with a competitive fixed interest rate and flexible terms.
Equipment Finance
Options to purchase, replace or upgrade your farming or farm business equipment.