Cropping exports 2022/23

Cropping exports 2022/23
Cropping commodity overview
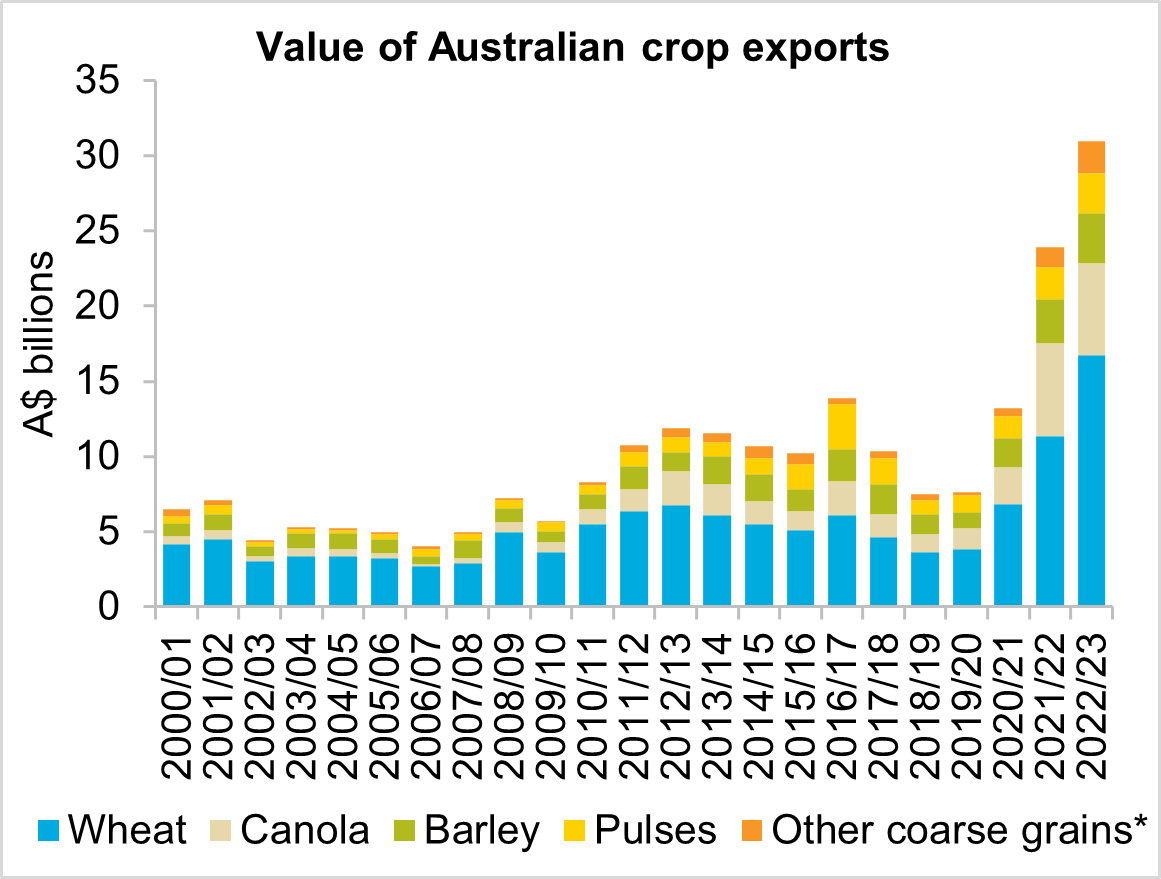
- The value of Australian cropping exports increased $7.08 billion (+29.6 per cent) in 2022/23 to a total of $30.99 billion.
- Record production for most Australian crops in 2022/23 was complimented with a new record average export price.
- A decline in cropping production brought about by below average seasonal rainfall will see the value of Australian cropping exports fall in 2023/24.
Trade performance in 2022/23
The value of Australian cropping exports increased for the fourth consecutive year in 2022/23. The $7.1 billion year-on-year increase pushed 2022/23 exports to a record $30.99 billion. Growth in the value of exports was driven by record production, strong export demand and record prices across several commodities. Wheat (+47.7 per cent), barley (+11.9 per cent), pulses (+24.6 per cent) and other coarse grains (+64.0 per cent) all recorded year-on-year increases in export value. The value of canola decreased 0.7 per cent from last year's record to $6.13 billion.
Increased Australian production resulted in a record 53.6 million tonnes exported in 2022/23. This was a 19.7 per cent increase on 2021/22 and 62.1 per cent above the five-year average. Record export volumes coincided with a new record average export price. The average price for all crops lifted 8.3 per cent year-on-year and was 20.2 per cent above the five-year average.
Wheat exports accounted for 54 per cent of the value of all cropping exports in the past year. Australia exported $16.7 billion of wheat in 2022/23, a 47.7 per cent year-on-year increase and 97.5 per cent above the five-year average. The large increase in export value was in part due to Asian stockfeed buyers substituting corn with Australian feed wheat. Many Asian buyers continued to avoid Black Sea wheat supplies due to concerns over financing, execution risks and inspection delays. These supply disruptions resulted in record prices and strong demand for Australian wheat.
The value of canola exports slipped 0.7 per cent from last year’s record to $6.13 billion. This was the second highest export value on record and 76.9 per cent above average. Production in 2022/23 increased for major producers Canada and the EU. This increased supply was met with continued growth and strong demand from the biofuel industry which saw consumption for oilseeds at record levels. This demand increase helped support Australian canola values. The volume of Australian canola exports increased 8.1 per cent from 2021/22 to a record 5.8 million tonnes. The average export price of canola decreased 8.1 per cent year-on-year to $1,059 per tonne.
The value of Australian barley exports posted a record high of $3.3 billion in 2022/23, an increase of 11.9 per cent on 2021/22 and 56.7 per cent above average. While the volume of barley exports decreased by 5.9 per cent year-on-year they remained strong in historical terms at 29.5 per cent above average. Volatility from the ongoing Russian-Ukraine conflict ensured that demand remained steady for Australian barley. This contributed to a 19 per cent rise in the average export price which reached a record high of $437 per tonne.
Australia exported $2.6 billion of pulses in 2022/23, growing 24.6 per cent on 2021/22. Improved Canadian production saw the average export price for pulses decrease 8.1 per cent year-on-year. However, the volume of pulse exports rose 17 per cent to 2.9 million tonnes offsetting this price reduction. Australian lentil exports to India continued to benefit from a zero tariff during 2022/23. As a result, the volume of lentil exports to India surged 263 per cent from previous year to a record 688 thousand tonnes. Lupin exports experienced a 60 per cent year-on-year increase on the back of record Australian production. Chickpea exports saw a modest 13 per cent increase in export volume from the previous year to 682 thousand tonnes. Area planted to this crop has reduced significantly in recent years due to poor returns for growers.
Major export markets
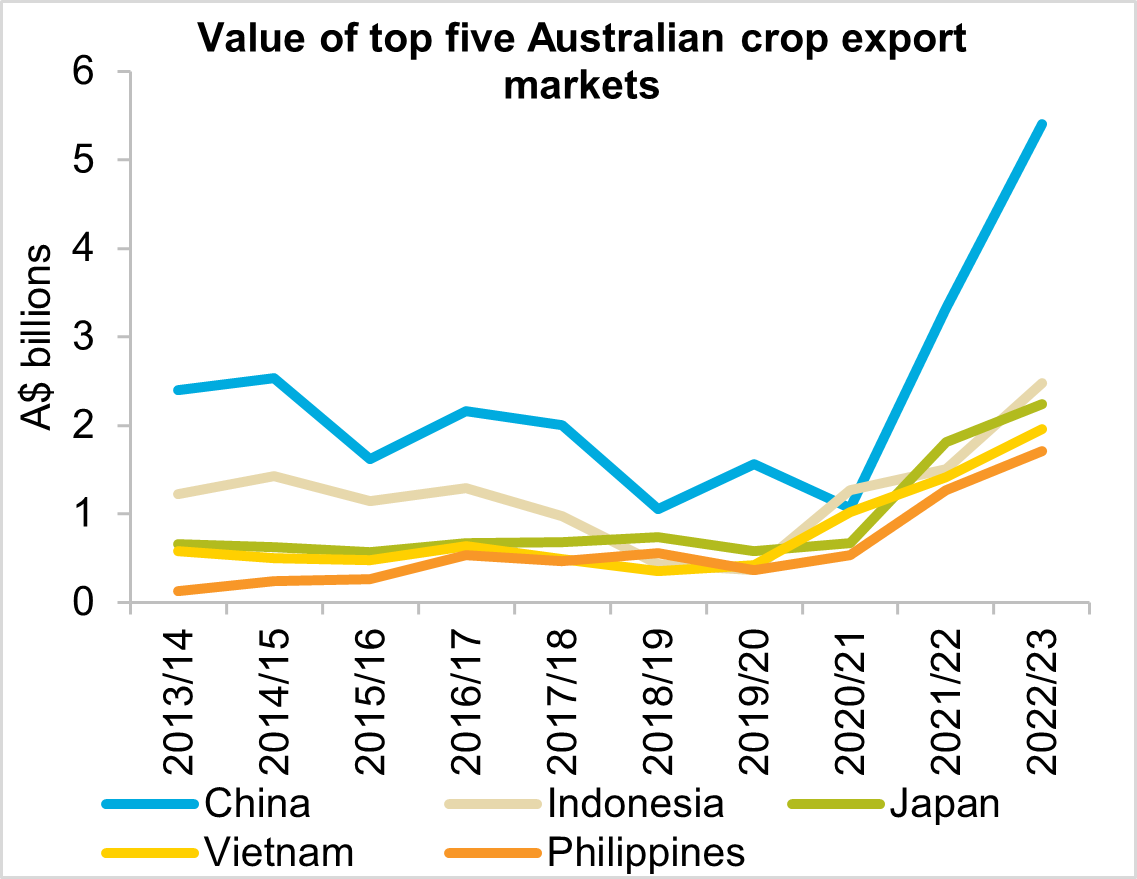
China retained its position as the largest market for Australian cropping exports for a second consecutive year. The value of cropping exports to China grew by a staggering 62.5 per cent to $5.4 billion. China’s appetite for Australian wheat continued to grow with export volume increasing 42 per cent year-on-year to a record 7.6 million tonnes. Exports of coarse grains also increased to record levels. Sorghum exports increased 43 per cent year-on-year to a record 2.4 million tonnes. Exports of oats were up 60 per cent year-on-year to a record 325 thousand tonnes. Combined, the value of coarse grains exports rose 71 per cent from the previous year to $1.4 billion.
Indonesia moved back into second position for the most valuable export market for Australian cropping exports with a market share of eight per cent. Indonesia imported $2.47 billion worth of Australian crops, a 63.8 per cent year-on-year increase. Cropping exports consisted mainly of wheat which made up 98 per cent of Indonesia’s cropping imports from Australia. This concentration of wheat exports was a common theme across four of the five top value export markets this year.
Japan came in just behind Indonesia as the third most valuable market for Australian cropping exports with a market share of 7.2 per cent. Japan imported $2.2 billion worth of Australian crops, a 23.7 per cent year-on-year increase. Japan stood out from the list of top exporters due to their diverse range of Australian crop imports. Wheat was the dominant crop exported to the other four major markets ranging from 71 per cent to 98 per cent of all exports. The balance of Japan’s total trade value was made up of canola (37 per cent), wheat (33 per cent), barley (25 per cent) and coarse grains (5 per cent).
Australian cropping exports to India experienced the largest percentage growth year-on-year. The overall value increased 211 per cent to $744 million. This saw India move from position 22 to 14 in terms of export value. The increase in export value was largely driven by the ongoing zero-per cent tariff policy on lentils. Australia was able to capitalise on this after producing a record lentil crop in 2022/23. Export volume of lentils to India increased by 263 per cent year on year to a record 688 thousand tonnes. This saw the value of pulse imports to India at their highest level in five years at $690 million. India is set to review this zero-per cent tariff policy in early 2024. This will be closely watched by the trade as a reintroduction of tariffs will have a large impact on the value of pulse exports for 2023/24.
Outlook for 2023/24
The global supply and demand balance sheet for grains and oilseeds will remain tight for the 2023/24 season. Early estimates of record northern hemisphere grain production have been cut back due to unfavourable summer conditions. This, combined with the ongoing Russia-Ukraine conflict which continues to provide uncertainty and volatility to the market, will continue to support above average export prices for Australian crops. Current estimates have 2023/24 Australian winter crop production falling by 34 per cent to 44.9 million tonnes. Although an El Niño event has not been declared by the Bureau of Meteorology yet, dry conditions are spreading through Australian cropping regions. As we move into the critical development stage for crops there is a high chance that these production forecasts could be cut further. At this stage, export volumes are forecast to fall by around 34.7 per cent to 34 million tonnes. A large carryout of stocks from the previous season will enable average export volumes to continue despite the decrease in production. This combined with exports prices staying historically high will see the overall value of Australian crop exports for 2023/24 stay at average levels.


Source: Global Trade Atlas
*includes sorghum, oats, maize, buckwheat, millet, rye and rice
Explore our other trade performance deep dives
Most Popular
Subscribe to insights today
Receive reports direct to your email by subscribing to Rural Bank Insights.

