Take a closer look into the drivers of a decline in Australia's agricultural exports.
National trade summary
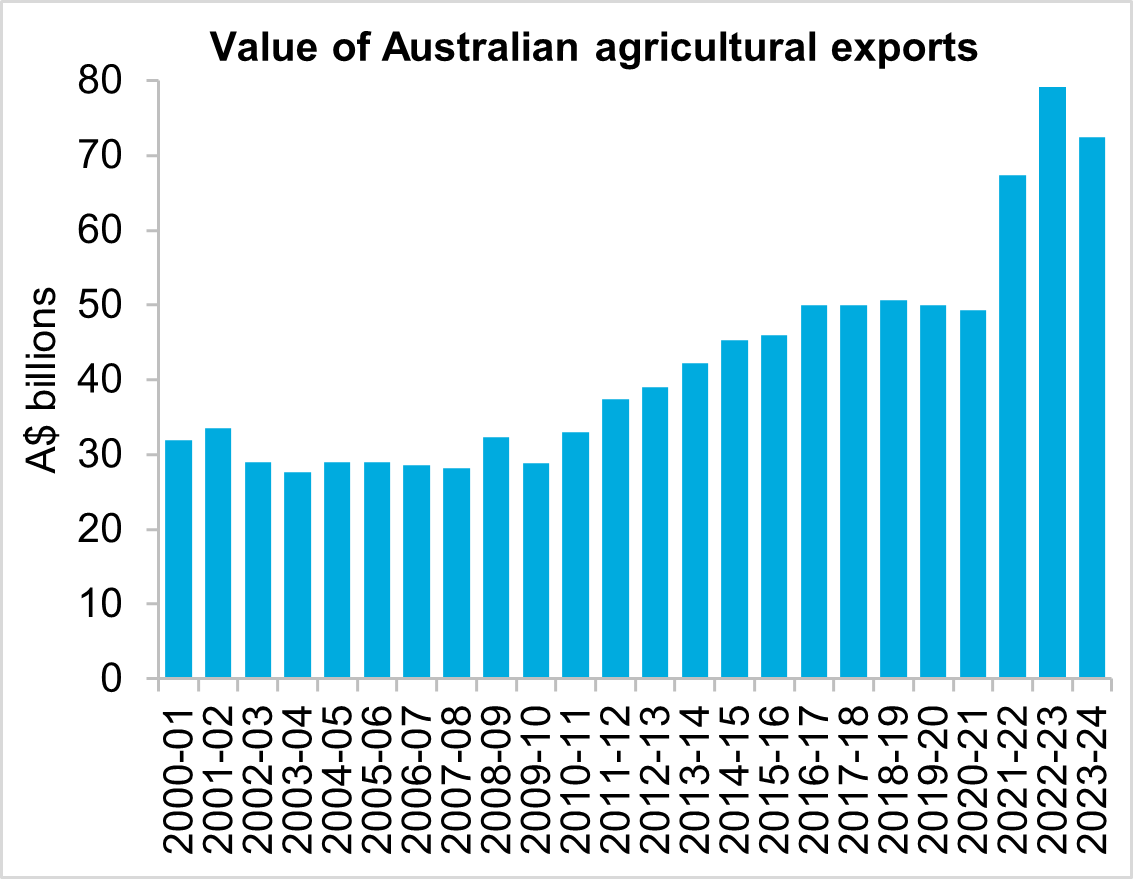
The value of Australian agricultural exports fell to $72.4 billion in 2023-24 as cropping exports declined after two record years. While this was the second most valuable export year on record, it was $6.7 billion (-8.5 per cent) lower than the record high achieved in 2022-23. Despite the decline, agriculture accounted for a slightly greater share of Australian goods exports, up to 13.5 per cent.
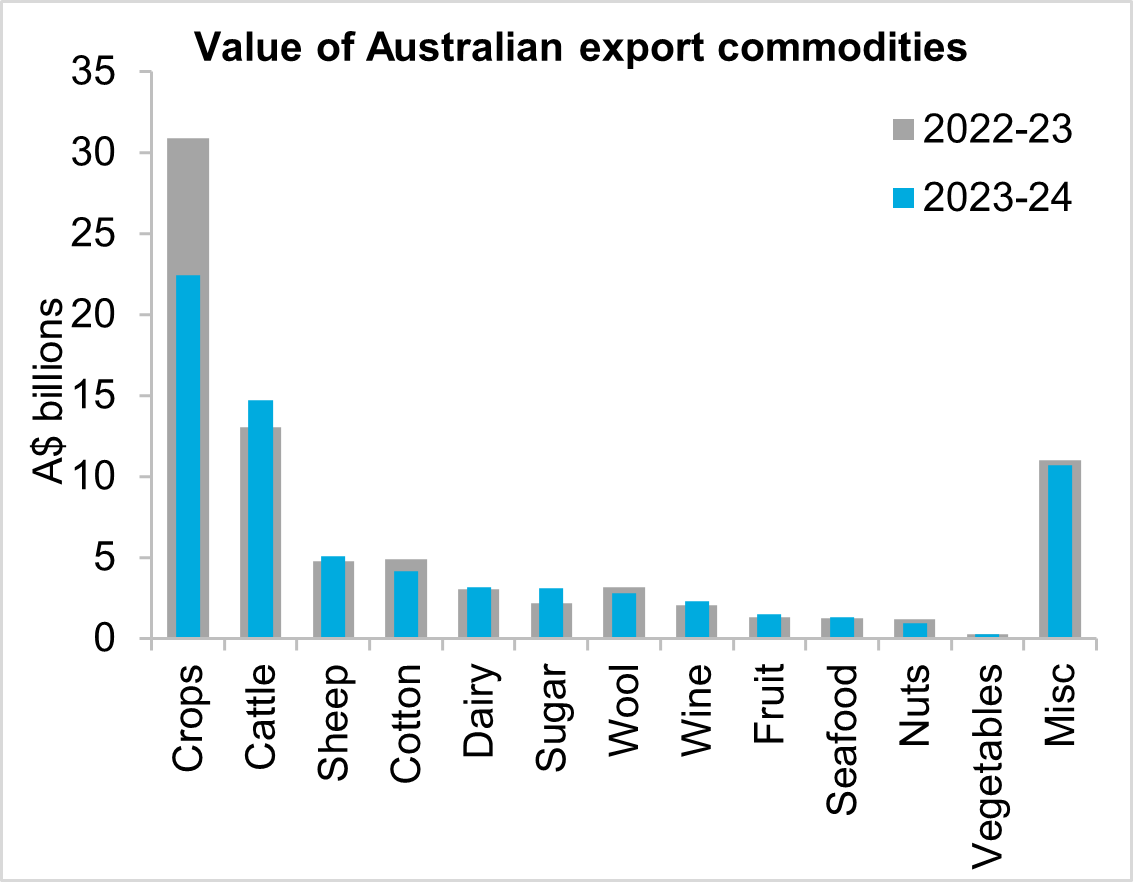
Cropping exports were the primary driver of the overall decline in agricultural export value in 2023-24. The value of crop exports fell $8.4 billion (-27.3 per cent). Lower production after two record years limited export volumes while prices also eased. It was still the third most valuable year for crop exports behind the preceding two years with a value of $22.4 billion. The majority of commodity groups saw growth in export value in 2023-24. The value of agricultural commodities, excluding crops, rose by $1.7 billion (+3.6 per cent) to a record high. Cattle industry exports saw the largest growth, with a rise of $1.6 billion (+12.3 per cent) driven by increased production following herd rebuilding. Sugar saw a fourth consecutive year of growth with increased production and a surge in prices leading to a strong rise of $889 million (+40.3 per cent). Moderate growth was seen for sheep industry exports, wine and fruit. Cotton, wool and nuts were the other commodities to record declines in export value in 2023-24. Each of these commodities saw falls between 12-17 per cent.
A further decline in the value of Australian agricultural exports is expected in 2024-25. As with 2023-24, lower crop export value is expected to weigh on the overall value. Although winter crop production is set to improve compared to last year, the volume of exports in the financial year is forecast to decline largely due to carryover stocks inflating 2023-24 volumes. Wool and dairy are also expected to see lower export values in 2024-25, with reduced production and prices impacting both sectors. Lower sheepmeat production but higher prices are set to push sheep industry export value slightly lower. Offsetting declines in these sectors is the expected continued growth in export value from the cattle industry. Higher average prices for red meat compared to 2023-24 is expected to support export value while beef production is also expected to expand. Horticulture is forecast to add some growth, driven by a general improvement in production and prices. Wine is also set to see growth in value following the resumption of access to the Chinese market in mid-2024.
Source: Global Trade Atlas (GTA)
Source: GTA
State export performance
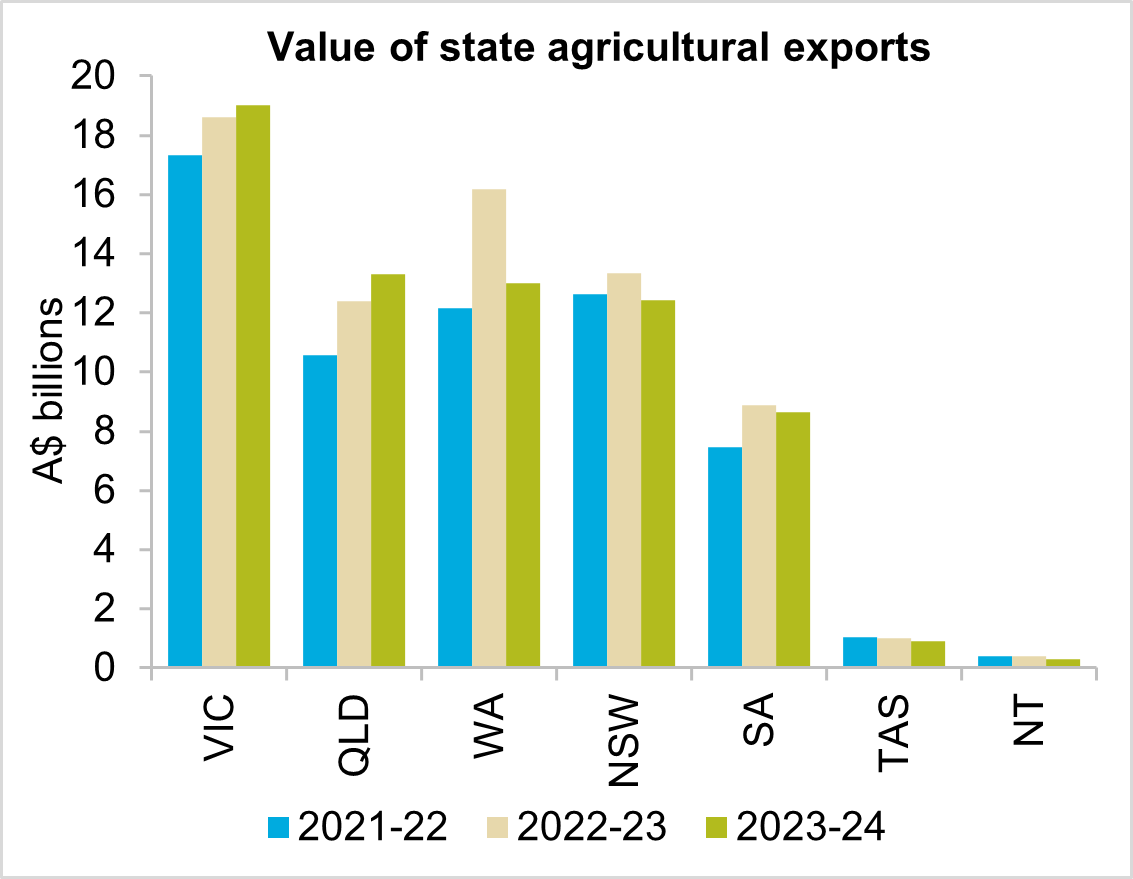
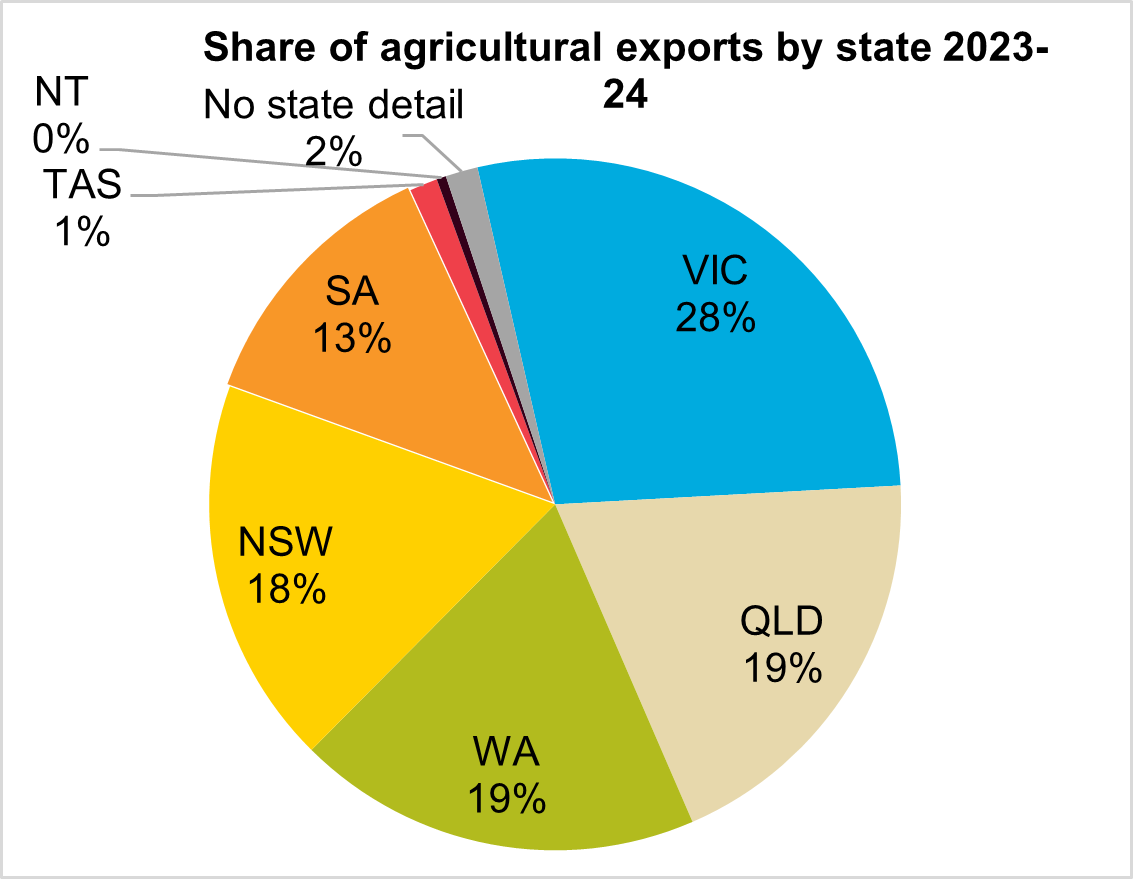
Victoria and Queensland were the only states to record an increase in export value in 2023-24. Victoria recorded a third consecutive year of growth to retain its title of number one exporter. Growth in sheep and cattle industry exports offset declines in cropping, wool and horticulture exports. Overall, Victoria saw a 2.2 per cent rise to $19 billion. Queensland saw growth of $898 million (+7.2 per cent) to leapfrog Western Australia and New South Wales to be the second largest exporter. Queensland export value was $13.3 billion in 2023-24. Growth in exports from Queensland was led by the cattle industry which saw an 8 per cent rise and accounted for 57 per cent of the state’s export value. Queensland also saw the value of crop exports fall by 53 per cent following two exceptional years.
Declines in crop exports drove overall export value from Western Australia, New South Wales and South Australia lower in 2023-24. Western Australia saw the largest decline with a $3.2 billion (-19.6 per cent) fall to $13.0 billion. While crop exports fell by $3.1 billion (-25.3 per cent) there were some bright spots. Rock lobster exports rebounded 31.3 per cent to have their best year since 2018-19 and avocado exports saw a leap from $7.1 million in 2022-23 to $36.1 million in 2023-24. New South Wales recorded a decline of $919.3 million (-6.9 per cent) to $12.4 billion. Crop export value fell by 49.8 per cent which was unable to be offset by a 19.6 per cent rise in the state’s cattle industry exports. South Australia only saw a $238.6 million (-2.7 per cent) decline to $8.6 billion. A 13.3 per cent decline in crop exports was almost counter balanced by improvements in wine and cattle industry exports. South Australia exported $340.6 million of wine to China between April-June. This was the second highest three-month period on record following exports of only $33.3 million in the three years while tariffs were in place.
Tasmanian exports fell to their lowest value since 2018-19 with a decline of $113.9 million (-11.3 per cent) to $897.6 million. The decline was led by a $95.2 million (-32.6 per cent) decline in salmon exports. A rise in Tasmanian sheep industry exports was outweighed by declines in dairy and wool exports. The Northern Territory recorded a fourth consecutive year of declining export value. Lower live cattle prices drove an $87.4 million (-22.3 per cent) fall, taking the Territory's export value to its lowest level since 2012-13.
Source GTA Note: state data does not include sugar.
Source: GTA Note: state data does not include sugar.
Export markets
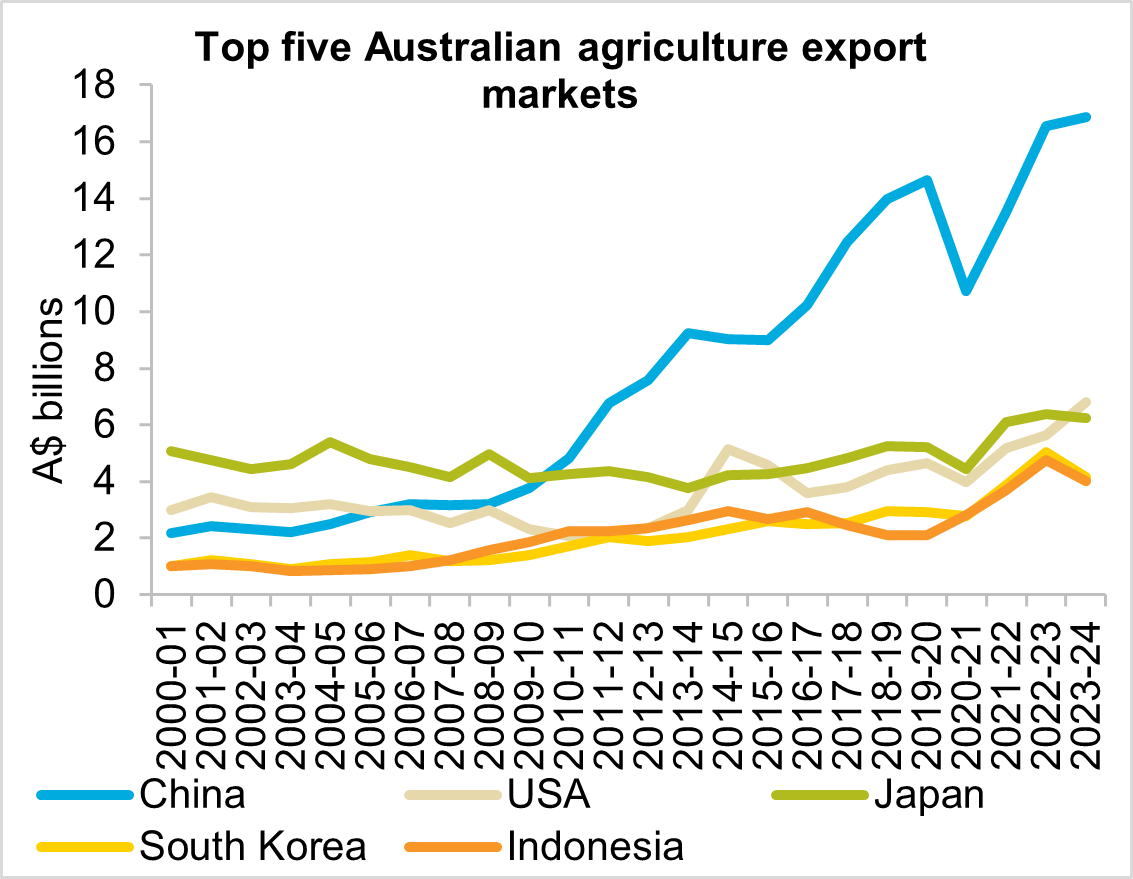
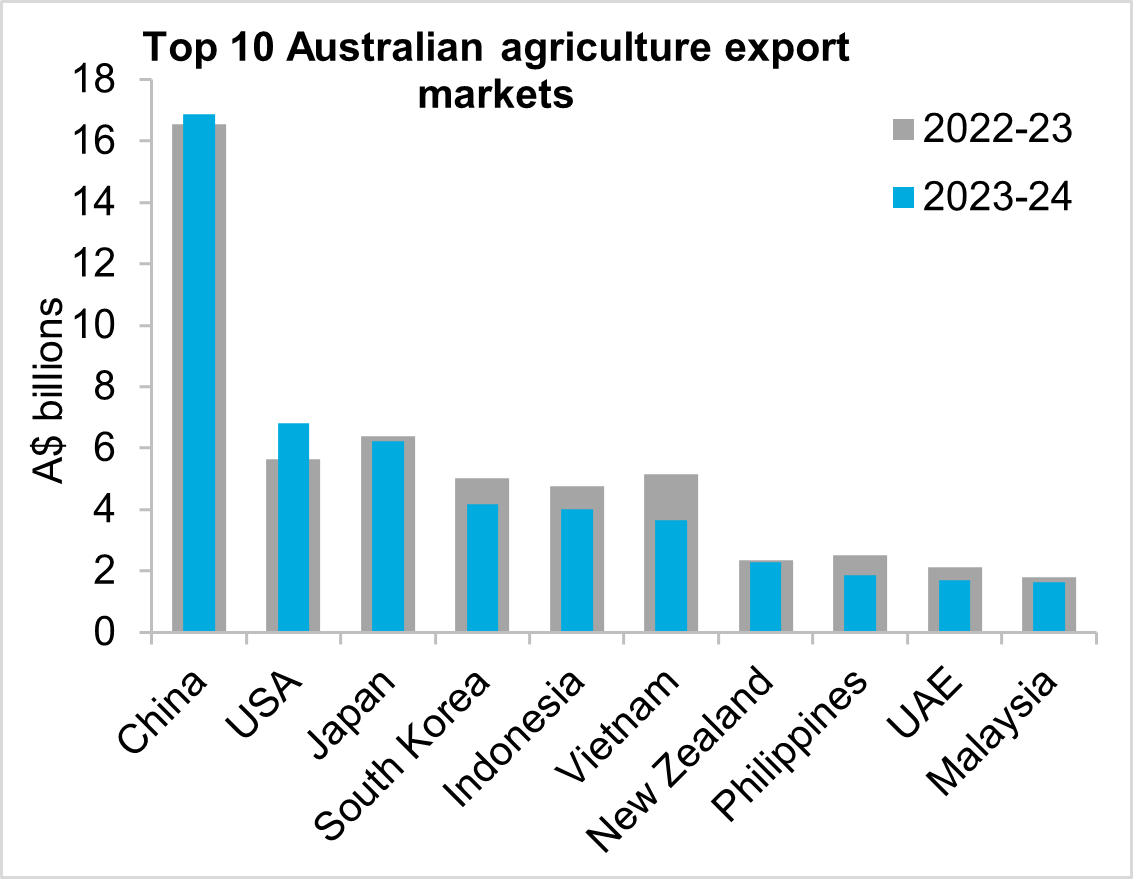
Australia’s major export markets predominantly saw declines in export value in 2023-24. While Australia’s two largest markets, China and the US, recorded an increase in the value of exports, the next 11 markets saw year-on-year declines. Of those 11 markets however, Australia’s export value to eight remained above 2021-22 levels. Growth to China and the US resulted in them accounting for 32.7 per cent of Australia’s agricultural export value, up from 28.0 per cent in 2022-23.
Although the value of crop exports to China grew through their return to the Australian barley market, almost all of Australia’s major trade partners were impacted by reduced crop production in 2023-24.
China remained Australia’s largest export market in 2023-24, building on the record set the previous year. Exports to China increased by $331 million (+2.0 per cent) to $16.9 billion, which followed a $3 billion (+22.4 per cent) increase in 2022-23. China accounted for 23.3 per cent of Australia’s total agricultural export value, the highest share since 2019-20. Export value grew mainly on the back of the return of barley exports. Barley exports to China jumped from nothing in 2022-23 to $2.3 billion this year, which accounted for 69.8 per cent of Australia’s total barley export value. Australia’s export value to China also benefitted from a jump in cotton and wine exports, which increased by $920.9 million and $376.5 million respectively. Most other major commodities saw year-on-year declines in export value to China, with cattle, dairy and sheepmeat falling the furthest.
The US saw the largest year-on-year growth in Australian agricultural exports in 2023-24. Export value climbed $1.2 billion (+21.2 per cent) to $6.8 billion, moving them above Japan to be the second largest market. Growth was mostly driven by a lift in beef exports which jumped $1.4 billion (+70.5 per cent). Lamb, dairy and wine export values also recorded year-on-year increases to offer support.
Australia’s next 11 largest export markets all recorded year-on-year declines in value. Generally stronger cattle exports were not able to account for a drop in cropping exports. Export value to Japan recorded a 2.2 per cent decline, resulting in Japan falling behind the US for the first time since 2015-16. South Korea and Indonesia rounded out the top five export markets, with the latter replacing Vietnam who fell from fourth to sixth.
Australia’s five largest trade partners accounted for 52.6 per cent of total export value, up from 48.9 per cent in 2022-23. This shows that as export value has fallen, Australia reliance on major trade partners has increased.
Source: GTA Note: export markets data does not include sugar.
Source: GTA Note: state data does not include sugar. Note: export markets does not include sugar.
Commodity performance
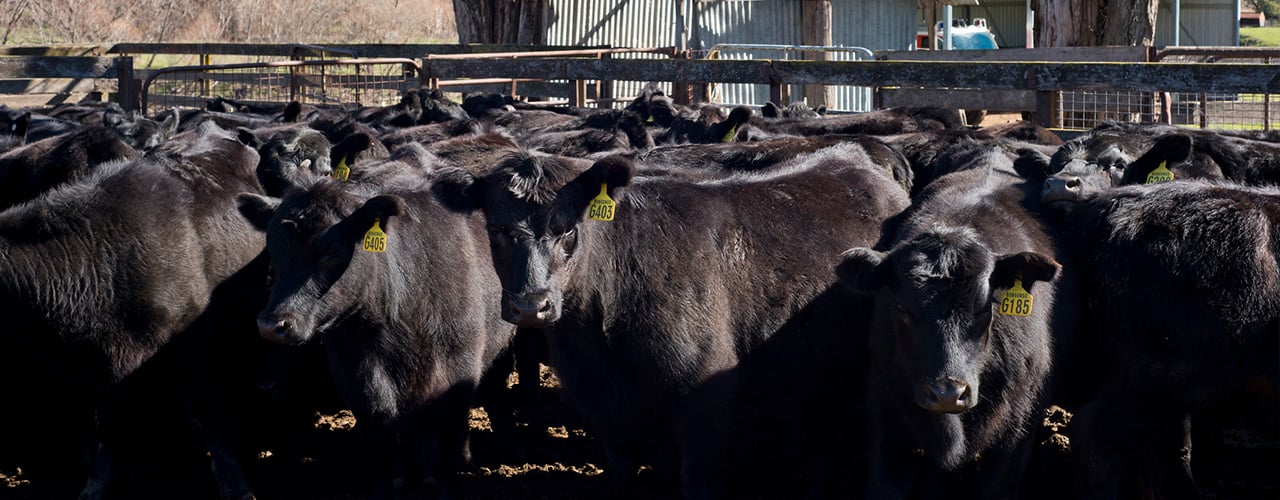
Cattle exports 2023-24
Increased production and strong US demand drove the value of Australian cattle industry exports to a new record high of $14.7 billion in 2023-24.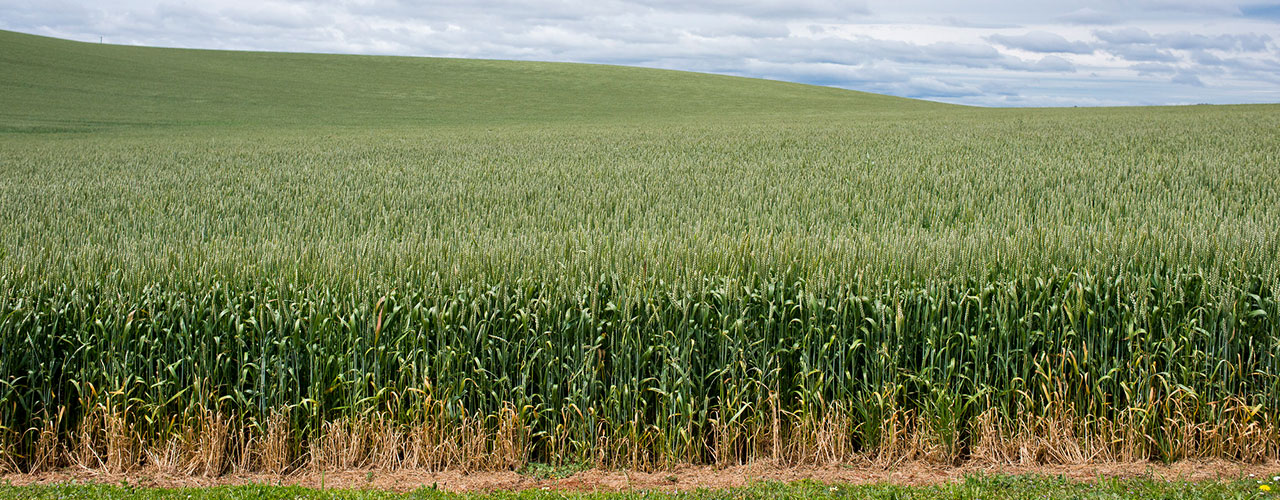
Cropping exports 2023-24
Lower production saw the value of Australian cropping exports fall 27 per cent in 2023-24, down from a record high.
Dairy exports 2023-24
Australian dairy exports increased to $3.1 billion in 2023-24 despite an 18 per cent decline in export value to China.
Horticulture exports 2023-24
Growth in citrus and stonefruit exports offset weaker nut exports to keep the value of Australian horticultural exports relatively steady in 2023-24.
Sheep exports 2023-24
Lower prices drove the value of Australian wool exports lower to $2.8 billion in 2023-24, despite an increase in production.
Wool exports 2023-24
Wool commodity overview The value of Australian wool exports fell $382.8 million (-12.0 per cent) in 2023-24 to a total of $2.8 billion. Weak...
Want more information?
Rural Bank recognises the importance of relevant information to enable sound business decision-making. To view our other reports please visit our Publications page. You can also receive reports direct to your email by subscribing to Rural Bank Insights.