Australian agriculture mid-year outlook 2024: Dairy
Australian agriculture mid-year outlook 2024: Dairy
Summary
Supply
Australian milk production will be flat to slightly lower, while global supply will remain relatively stable.
Demand
Domestic demand is expected to remain steady, while global demand will be mostly flat.
Price
Farmgate prices are down from record highs. Global prices will see some volatility but will remain around average levels.
Outlook
Lower farmgate milk prices will pressure farm profitability as global demand and pricing remains subdued.
From the field
"Dairy farmers will have to contend with tighter margins in the upcoming season. While input costs have stabilised, lower farmgate prices will reduce profitability. Seasonal conditions vary significantly in the dairy regions with some facing very tough conditions that will challenge milk production in those areas, but the national milk pool should remain reasonably stable if slightly down on last year. With recent seasons delivering favourable economic conditions, milk producers have had the opportunity to invest in their businesses which will help them cope with lower prices this season. For most dairy farmers a profitable season inf the 24/25 season remains on the cards, but dry conditions will see some facing a tough year ahead."
Mik Harford, Agribusiness Relationship Manager – Leongatha
Overview
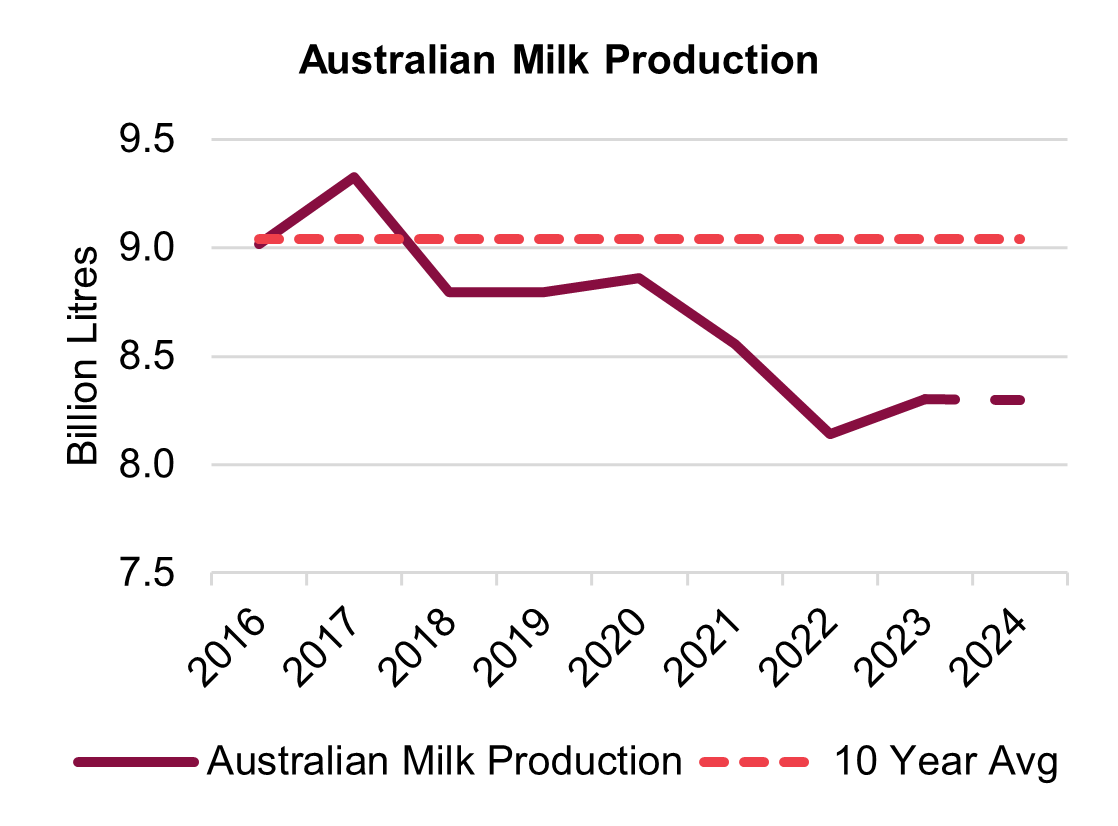
Australian dairy farmers are forecast to produce around 4.6 billion litres in the second half of 2024. This is on par with the 4.62 billion litres produced from July to December 2023, but 4.5 per cent below average. The number of farmers exiting the dairy industry will continue to slow down through 2024. Good weather and high prices in 2023/24 boosted profits for farmers. This has resulted in greater confidence in farm businesses as detailed by Dairy Australia’s Situation and Outlook report. Results of the 2024 National Dairy Farmer Survey indicate 57 per cent of dairy businesses believe they are in a stable phase. This is a four per cent increase on last year. However, dairy operations reported to be in an expansion phase sit at 23 per cent. This is largely unchanged year-on-year despite a mostly advantageous seasonal and pricing environment. Steadier farm and herd numbers are expected to see milk production mostly unchanged. However, there is some potential for downside. Dry conditions in some areas may see reduced output. Lower farmgate prices in 2024/25 are also likely to see producers considering the number of milking cows given increased margin pressure. Based on current conditions, we expect to see milk production in the second half of the year similar to or slightly below last year.
Looking longer term, there is a lot of talk about Australian milk production ‘stabilising’. This is the case insofar as production declines have reversed for the time being. However, it is important to recognise potential for further downturns. Farmer exits and declining herd numbers may have slowed. But bear in mind that seasonal conditions have been favourable for the past two seasons. Based on current conditions, production is forecast to hold steady. But an extended run of dry conditions could result in milk production dropping below 8 billion litres.
Global milk supply is also forecast to remain flat in coming months. Production in major exporting nations is lacklustre with none expecting significant growth. Declining herd numbers in the European Union is offset by increasing efficiency per cow. Although, adverse weather conditions are still forecast to see EU milk production decline marginally in 2024. Milk production in the United States has been trending slightly lower as herd numbers continue to decline. But the United States Department of Agriculture (USDA) forecasts full year production to finish one per cent higher than 2023. New Zealand milk production season to date is marginally lower year-on-year. This trend is expected to continue for the rest of 2024 with final production similar to last year. Marginal production increases or decreases in major dairy exporting regions paint an overall picture of flat global milk production.
Demand
Domestic demand for dairy products remains firm and continues to grow. Consumption of butter, cheese, dairy spreads, and yoghurts in 2024 are up around 1-2 per cent year-on-year. This trend is expected to be maintained or level out in the second half of the year. Regardless, cost of living pressures have changed consumer behaviour. Cost conscious households are showing a preference for private label products over brand name products. This has also seen an increase in demand for imported products. Elevated Australian farmgate prices has seen an influx of cheaper dairy imports. Australia’s trade balance (export value minus import value) reached a record low 62 per cent in 2023. Having said this, the volume of imported dairy products is now past its peak and is expected to continue to ease in coming months. Lower farmgate prices will increase the competitiveness of locally processed products compared to imported dairy. Though the lower milk production will also see imported dairy products continue to compete for local demand.
Global demand is forecast to remain lacklustre in coming months. China remains key to global dairy demand forecasts. Chinese milk production has lifted 34 per cent over the past decade. This is the result of a concerted effort to reduce reliance on imports. Stockpiling of milk powder led to an oversupply which has seen Chinese imports almost halved from 2021 to 2023. Chinese milk powder imports are forecast to fall another 4 per cent in 2024. Improved self-sufficiency in China means import demand is unlikely to lift significantly. This applies to short term outlooks as well as longer term views. Demand from the Middle East and South-East Asia is expected to remain consistent. Demand from North Asia has been sporadic, jumping into the market as required. But demand from these regions doesn’t make up for the loss of Chinese demand. Inflationary pressures also continue to weigh on consumer sentiment in export markets. This is particularly true for key growth markets in Asia where dairy is less of a staple food item. Based on these considerations, global demand for dairy will remain subdued through 2024.
Prices
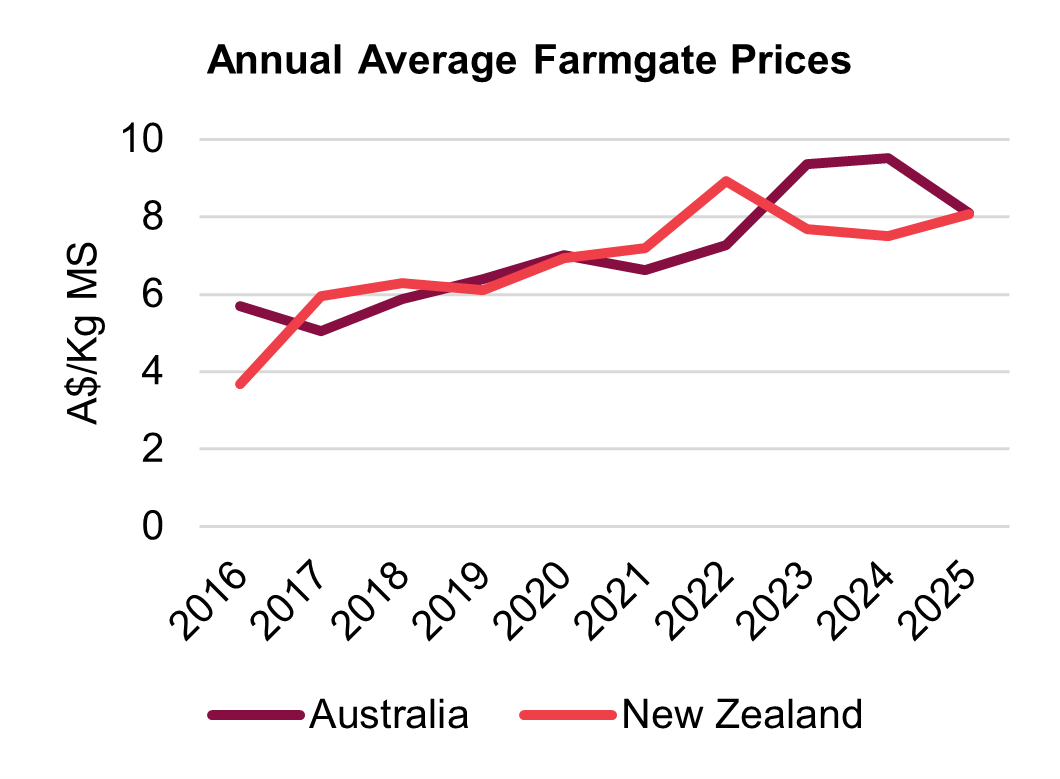
Farmgate milk prices are forecast to remain steady in coming months at around $8.10/Kg MS. There is a possibility for minor step-ups heading into the peak production period in spring. But any step ups can be expected to be modest. The average farmgate milk price isn’t expected to lift significantly, if at all, before spring. This is in stark contrast to last season's fierce competition between processors. Opening bids lifted around seven per cent within weeks to a record high average around $9.51/Kg MS. In 2024, processors projected lower farmgate prices in the lead up to the new season. They will be much more conservative when considering increasing prices this year. Competition between processors to secure supply drove record high prices last season. This left some without sufficient supply. Others with supply found the price to secure it made the cost of production uncompetitive with cheaper product from other countries. There is currently a low level of competition for milk supply as processors want to avoid a repeat of the bidding war seen last season. Producers understand the pressures that processors have faced but are hopeful the pricing pendulum doesn’t swing too far the other way. An additional 40 cents to lift farmgate prices to $8.50/Kg MS would be seen as more equitable in the eyes of producers. Australian farmgate prices in 2023/24 are around 30 per cent higher than New Zealand’s (NZ) when converted to Australian dollars. NZ 2024 farmgate milk prices are forecast at around A$8.07/Kg MS, close to parity with new season Australian prices. This price differential is much more sustainable for Australian processors who will be reluctant to lift farmgate prices to remain in order to competitive.
Global dairy prices are anticipated to remain around average levels for the rest of the year. Though some volatility is expected to remain a feature. Flat global supply and lower volume offerings in trade events provide a level of support for prices. But reduced Chinese demand means global supply is sufficient for anticipated demand in coming months. A high inflation environment is dampening global demand for dairy products. This is anticipated to weigh on potential price upside. Volatility is expected to remain a feature in product categories based on supply volumes and sporadic demand. But limited supply and tepid demand will limit sustained gains or losses in global dairy prices.
Outlook
Australian milk producers face a more challenging second half of the year than in 2023. This is to be expected following record high farmgate prices and favourable seasonal conditions. All producers have to contend with lower returns for supply which will pressure margins. Some are facing tougher seasonal conditions which may limit output. But it’s not all bad news and there is some optimism for the first half of the 2024/25 season. Lower farmgate prices aren’t positive for producers, but they should facilitate improved ability to compete for both local and export demand. Feed availability has been bolstered by positive summer and autumn rainfall and pasture growth. Input costs continue to ease and are expected to remain under pressure or at worst level out. Water availability is strong, and prices remain below average levels. The Australian dairy industry has been in a state of contraction for years now. Farmer exits and processor downsizing has been a prominent feature in recent seasons. But from a farm business perspective, we’re coming off the most financially positive period the industry has seen. Record high farmgate prices over the past two seasons have allowed some to take advantage of improved margins. Farm businesses have had the opportunity to invest in improving efficiency. It has allowed some to set up their businesses to ride out a tougher year. It's also provided the opportunity to make financial decisions with a view to the future. Lower farmgate prices and less certain seasonal conditions mean the coming six months will be more difficult than last year. But it is hoped that the unprecedented favourable economic conditions over the past two seasons will help producers navigate the ongoing recalibration of the Australian dairy industry.
Explore our other commodities
Most Popular
Related Articles
Australian agriculture outlook 2024: Horticulture
Australian agriculture mid-year outlook 2024: Sheep