Tom Herbert (Junior Data Analyst)
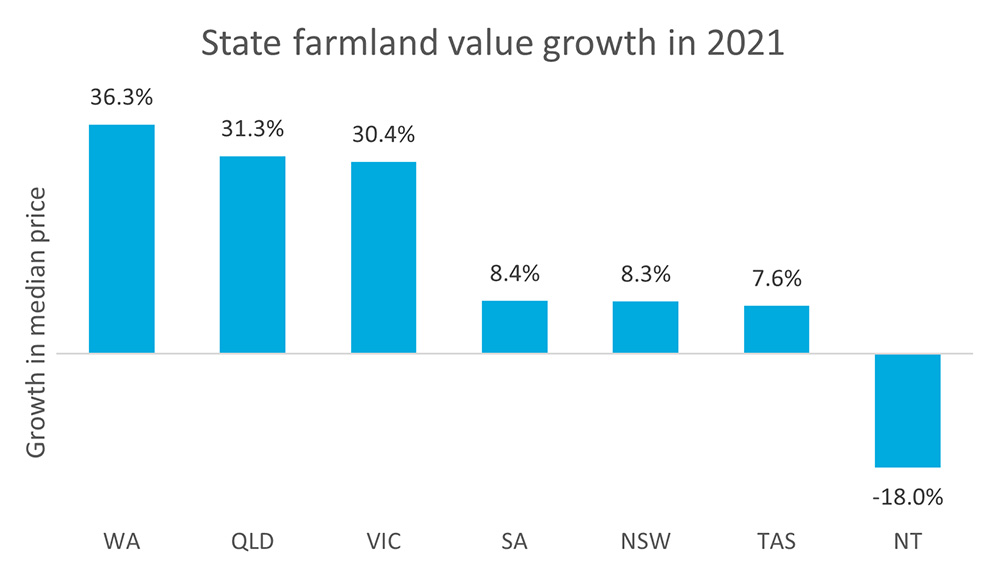
Australian farmland recorded it’s eighth consecutive year of growth in 2021. On a national level the median price per hectare experienced a jump of 20 per cent year-on-year. As growth was a major theme throughout most of the nation, there were significant differences across each state. Throughout this article, we rank all states from largest to smallest growth.
Strong growth states
- Western Australia (+36.3%) - Taking the top spot for 2021 was Western Australia with exceptional growth of 36.3 per cent, rising to $4,178/ha. This change comes off the back of another great season, particularly for the cropping sector along with low interest rates and favourable seasonal conditions convincing buyers to seek more land. A focus on higher valued transactions helped spike the median price per hectare in 2021.
- Queensland (+31.3%) – Coming in less than one per cent in front of Victoria was Queensland with an extraordinary rise of 31.3 per cent to $6,827/ha. This state saw a spike in both transaction volume and value in 2021. Increased median prices were driven by strong demand for smaller, higher valued lots in prime farming land close to population centres. Additionally, a renewed interest in rural lifestyle aided in the significant change to the median price per hectare.
- Victoria (+30.4%) – Moving into the top three states for largest growth, Victoria experienced a phenomenal jump of 30.4 per cent to move to $10,583/ha. Like other states before it on this list, strong commodity prices, low interest rates and favourable seasonal conditions applied upwards pressure on the median price per hectare.
Moderate growth states
- South Australia (+8.4%) – Coming in at the middle of the table is South Australia, which jumped 8.4 per cent in 2021 to reach $5,940/ha. Strong demand throughout a period of low interest rates, rising commodity prices and strong production throughout the state led to an increase in the median price per hectare in 2021.
- New South Wales (+8.3%) – New South Wales recorded a modest rise in median price per hectare in 2021 of 8.3 per cent to $6,827/ha. The rise can be attributed to a strong demand exceeding an increase in the number of transactions. Favourable seasonal conditions, firm commodity prices and” tree-changers” moving to regional areas all helped boost the median price per hectare for the state.
- Tasmania (+7.6%) – Tasmania finished 2021 with a modest increase of 7.6 per cent to its median price per hectare. This was still a record median price for the state at $14,730/ha. This rise came on the back of constrained supply, low interest rates and firm demand for land. The state saw a rise in family growers expanding along with a jump in corporate buyers. Both changes helped boost the median price per hectare upwards.
Negative growth state
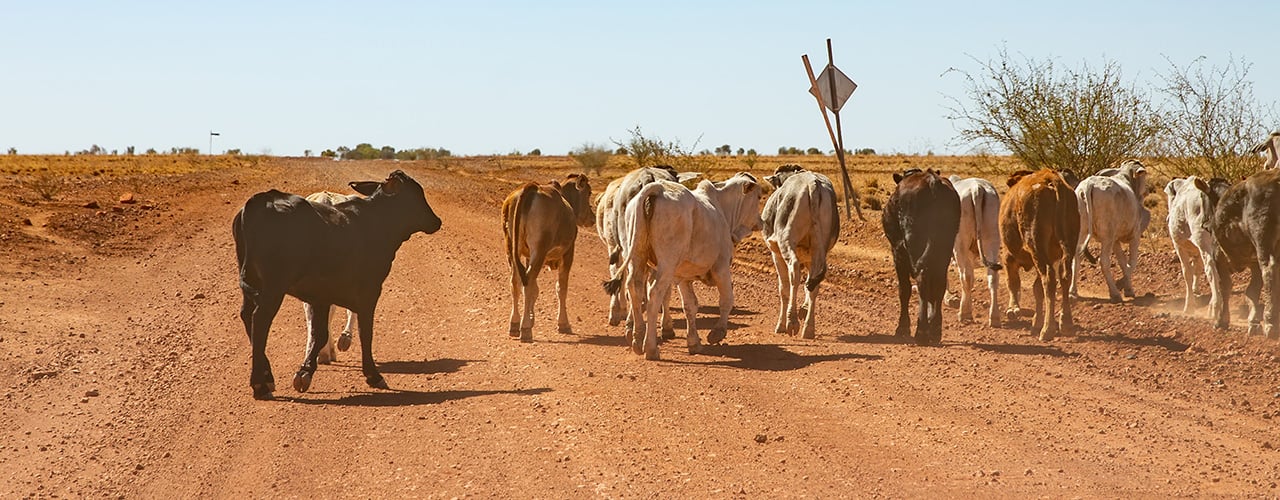
- Northern Territory (-18.0%) – The Northern Territory experienced a sharp decline of 18 per cent in 2021. A low number of transactions in the Northern Territory can cause the median price to be quite volatile. In 2021, there was a greater proportion of transactions in cattle station regions. These have a very low price per hectare and helped push the overall median price per hectare lower.
To get access to more detail on how each state performed in 2021 subscribe to Rural Bank Insights and download our Australian Farmland Values report.
This article is intended to provide general information on a particular subject or subjects and is not an exhaustive treatment of such subject(s). The information herein is believed to be reliable and has been obtained from public sources believed to be reliable. Rural Bank, a Division of Bendigo and Adelaide Bank Limited, ABN 11 068 049 178 AFSL/Australian Credit Licence 237879, makes no representation as to or accepts any responsibility for the accuracy or completeness of information contained in this report. Any opinions, estimates and projections in this report do not necessarily reflect the opinions of Rural Bank and are subject to change without notice. Rural Bank has no obligation to update, modify or amend this article or to otherwise notify a recipient thereof in the event that any opinion, forecast or estimate set forth therein, changes or subsequently becomes inaccurate. This article is provided for informational purposes only. The information contained in this article does not take into account your personal circumstances and should not be relied upon without consulting your legal, financial, tax or other appropriate professional.
Related Articles
-
Does farmland outperform other asset classes?
Farmland, residential housing or share markets - who is the strongest asset class of them all? -
From beef to grains: assessing FMD performance in key agricultural sectors
What is the FMD scheme and why is it important in managing difficult conditions in agriculture. -
How is seasonal labour supply shaping up in 2023
How has labour availability improved and which industries are still under strain.