The value of Australian farmland has grown at an extraordinary pace in recent years. Recent growth is a continuation of a longer-term upward trend in values. But does growth in farmland values perform well compared to other asset classes? In this post we outline how farmland has outperformed residential housing and share markets.
Australian farmland’s strong growth
As reported in our Australian Farmland Values 2023 report, the median price of Australian farmland increased for a ninth consecutive year in 2022. Growth of 20 per cent in 2022 kept pace with the rise seen in 2021. This strong rate of growth was achieved despite the headwinds from high input costs and rising interest rates.
Downturn in residential housing in 2022
The performance of farmland values in 2022 was in stark contrast to residential housing. The national average price of residential dwellings in the final quarter of 2022 was 5.3 per cent lower than a year earlier, according to data from the Australian Bureau of Statistics. This followed growth of 25 per cent in 2021. The sharp change of direction in 2022 is largely attributed to rising interest rates and rising costs of living biting into demand. This is evident in prices rising in the first two quarters of 2022 before rising interest rates started to take effect. The September quarter alone saw a 5.3 per cent decline in prices followed by a 3.2 per cent fall to December. This swift reaction to interest rate rises highlights the different nature and drivers of the farmland and residential property markets. While housing is more exposed to interest rates, farmland enjoyed a buffer from good operating returns in recent years to keep fuelling buying power.
Slowdown in the Australian share market in 2022
Like residential housing, the Australian share market also experienced a downturn in 2022. The ASX200 closed 2022 5.5 per cent lower year-on-year. This followed a rise of 13 per cent across 2021. The ASX200 was also lower when accounting for dividends with the accumulation index of the ASX200 down 1.1 per cent across 2022. The downturn in shares was even stronger in the US with the S&P 500 falling 19.4 per cent across 2022. This followed an exceptional gain of 26.9 per cent in 2021. Again, this highlights the different drivers of the farmland market compared to share markets.
Farmland has outperformed over the longer-term
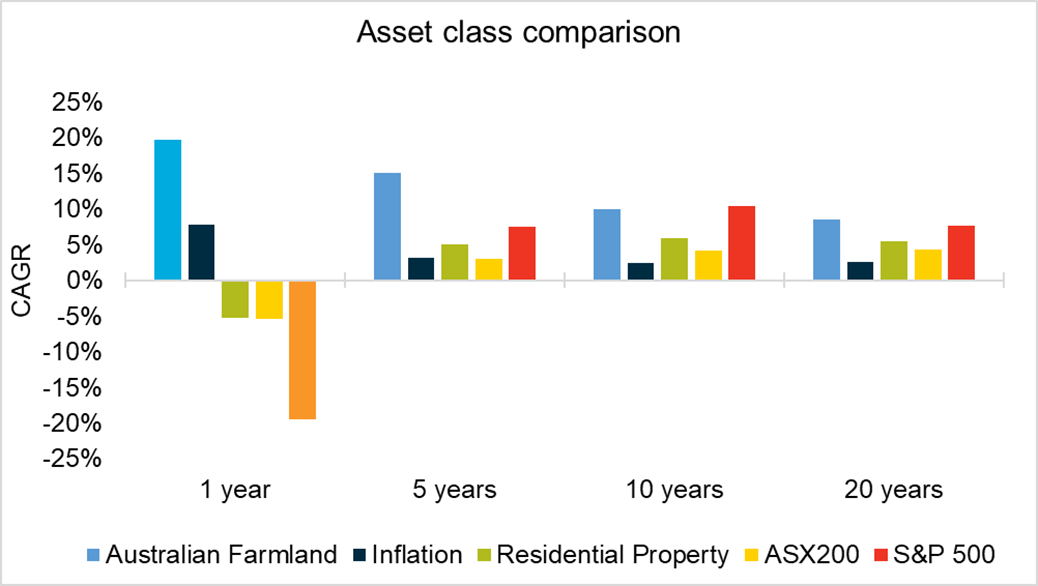
In addition to bucking the trend of downturns in housing and share markets, farmland has outperformed these asset classes over the longer-term. Farmland’s recent run of growth is part of a long-term growth trend. Over the last 20 years, the national median price has risen at a compound annual growth rate (CAGR) of 8.5 per cent. Growth has been stronger than this in recent times with a five-year CAGR of 15.2 per cent and a 10-year CAGR of 10.1 per cent. As the chart below shows, the growth rates of Australian farmland outperform each of these asset classes over almost all time horizons. The only occasion that farmland hasn’t come out on top is against the S&P 500’s 10-year CAGR of 10.4 per cent. When accounting for dividends, the ASX200 outperforms farmland over 20-years with a CAGR of 8.9 per cent. However, this would be an unfair comparison. Adding operational returns or rental income to the performance of farmland values would no doubt add to its credentials as an asset class.
While farming is a volatile industry beholden to the cycles of the weather and global markets, the value of farmland has proved to be resilient over the last few decades. Not only have farmland values withstood the various agricultural and economic downturns that have arisen, it has continued to grow and performs well as an asset class in its own right.
Related Articles
-
From beef to grains: assessing FMD performance in key agricultural sectors
What is the FMD scheme and why is it important in managing difficult conditions in agriculture. -
How is seasonal labour supply shaping up in 2023
How has labour availability improved and which industries are still under strain. -
Whose plate will record lamb production end up on?
As the weather cools down and chops on the barbie get swapped for roasts in the oven, we take a look at whose plate lamb will end up on this year.