Introduction
In Australia, agriculture plays a crucial role in the nation’s economy. Farmers face various challenges, including unpredictable weather patterns, market fluctuations and input costs. To assist farmers in managing these risks the Australian government introduced the Farm Management Deposits (FMD) scheme in 1999. The FMD scheme allows farmers to set aside up to $800,000 of pre-tax income that can be withdrawn in low-income years, such as during a drought. This blog post will explore the evolution of the FMD scheme and its uptake across industry sectors.
National Holdings: Rise, Fall and Resurgence
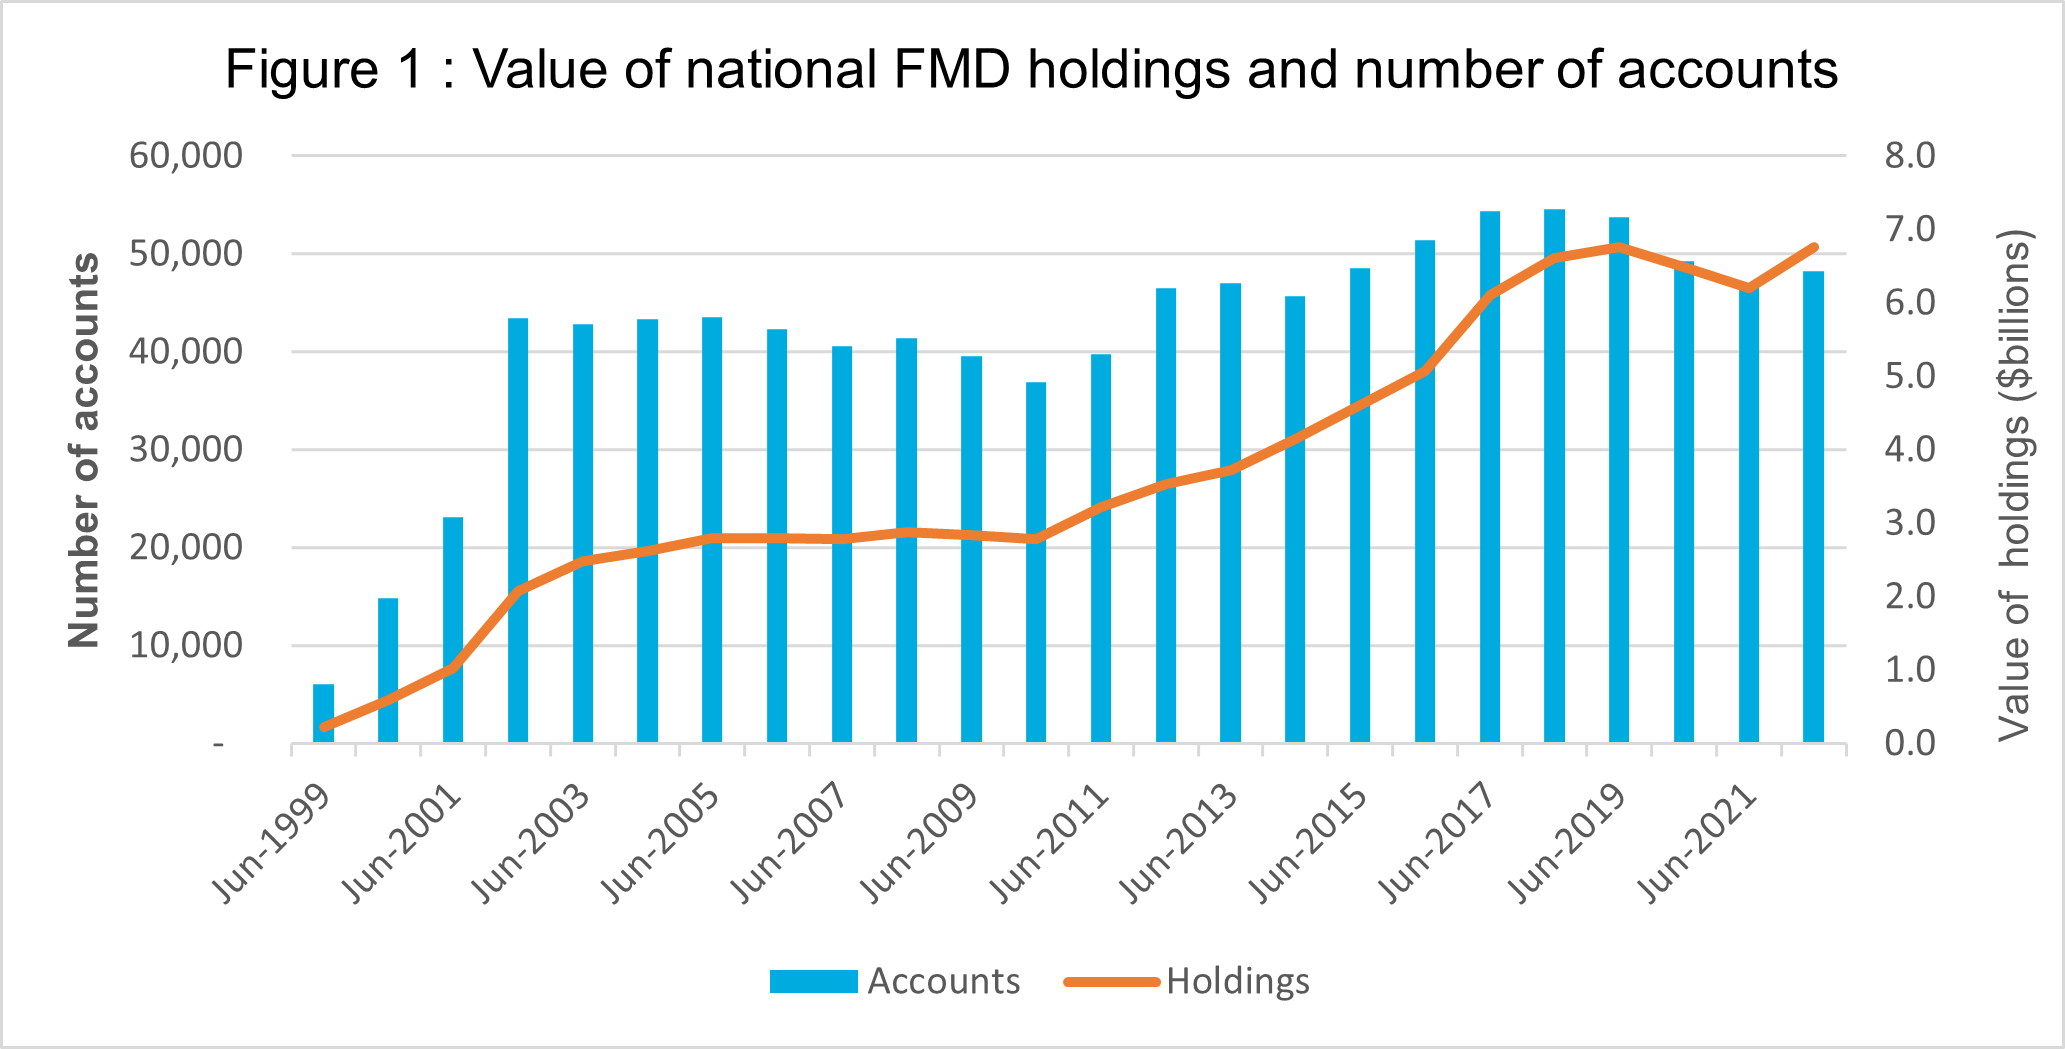
Since the scheme started in 1999, FMD holdings steadily increased to reach a peak of $6.75 billion in June 2019 (Figure 1). This was then followed by two years of drawdowns during a period of drought across much of the country. In June 2021 the holdings were around $6.2 billion, representing a decline of 8 per cent over the two-year period. The number of FMD account users also dropped from 53,790 to 46,946, a decline of 13 per cent.
After three consecutive good years for many producers FMD holdings have begun increasing again. FMD value reached a new record of $6.76 billion in June 2022. New South Wales led the charge with an 18 per cent increase for the year ending June 2023. With record grain production in 2022/23 holdings could surpass $7 billion for the first time at the end of this financial year. The number of accounts has not bounced back by the same rate as holdings. Account numbers as of June 2022 were 48,284 still 11 per cent seen below their peak set in 2018. This could be due to farm consolidation during drought years leading to larger farms but less producers. It may also represent consolidation of the number of FMD accounts held by individuals.
FMD Uptake: A State and Territory Snapshot
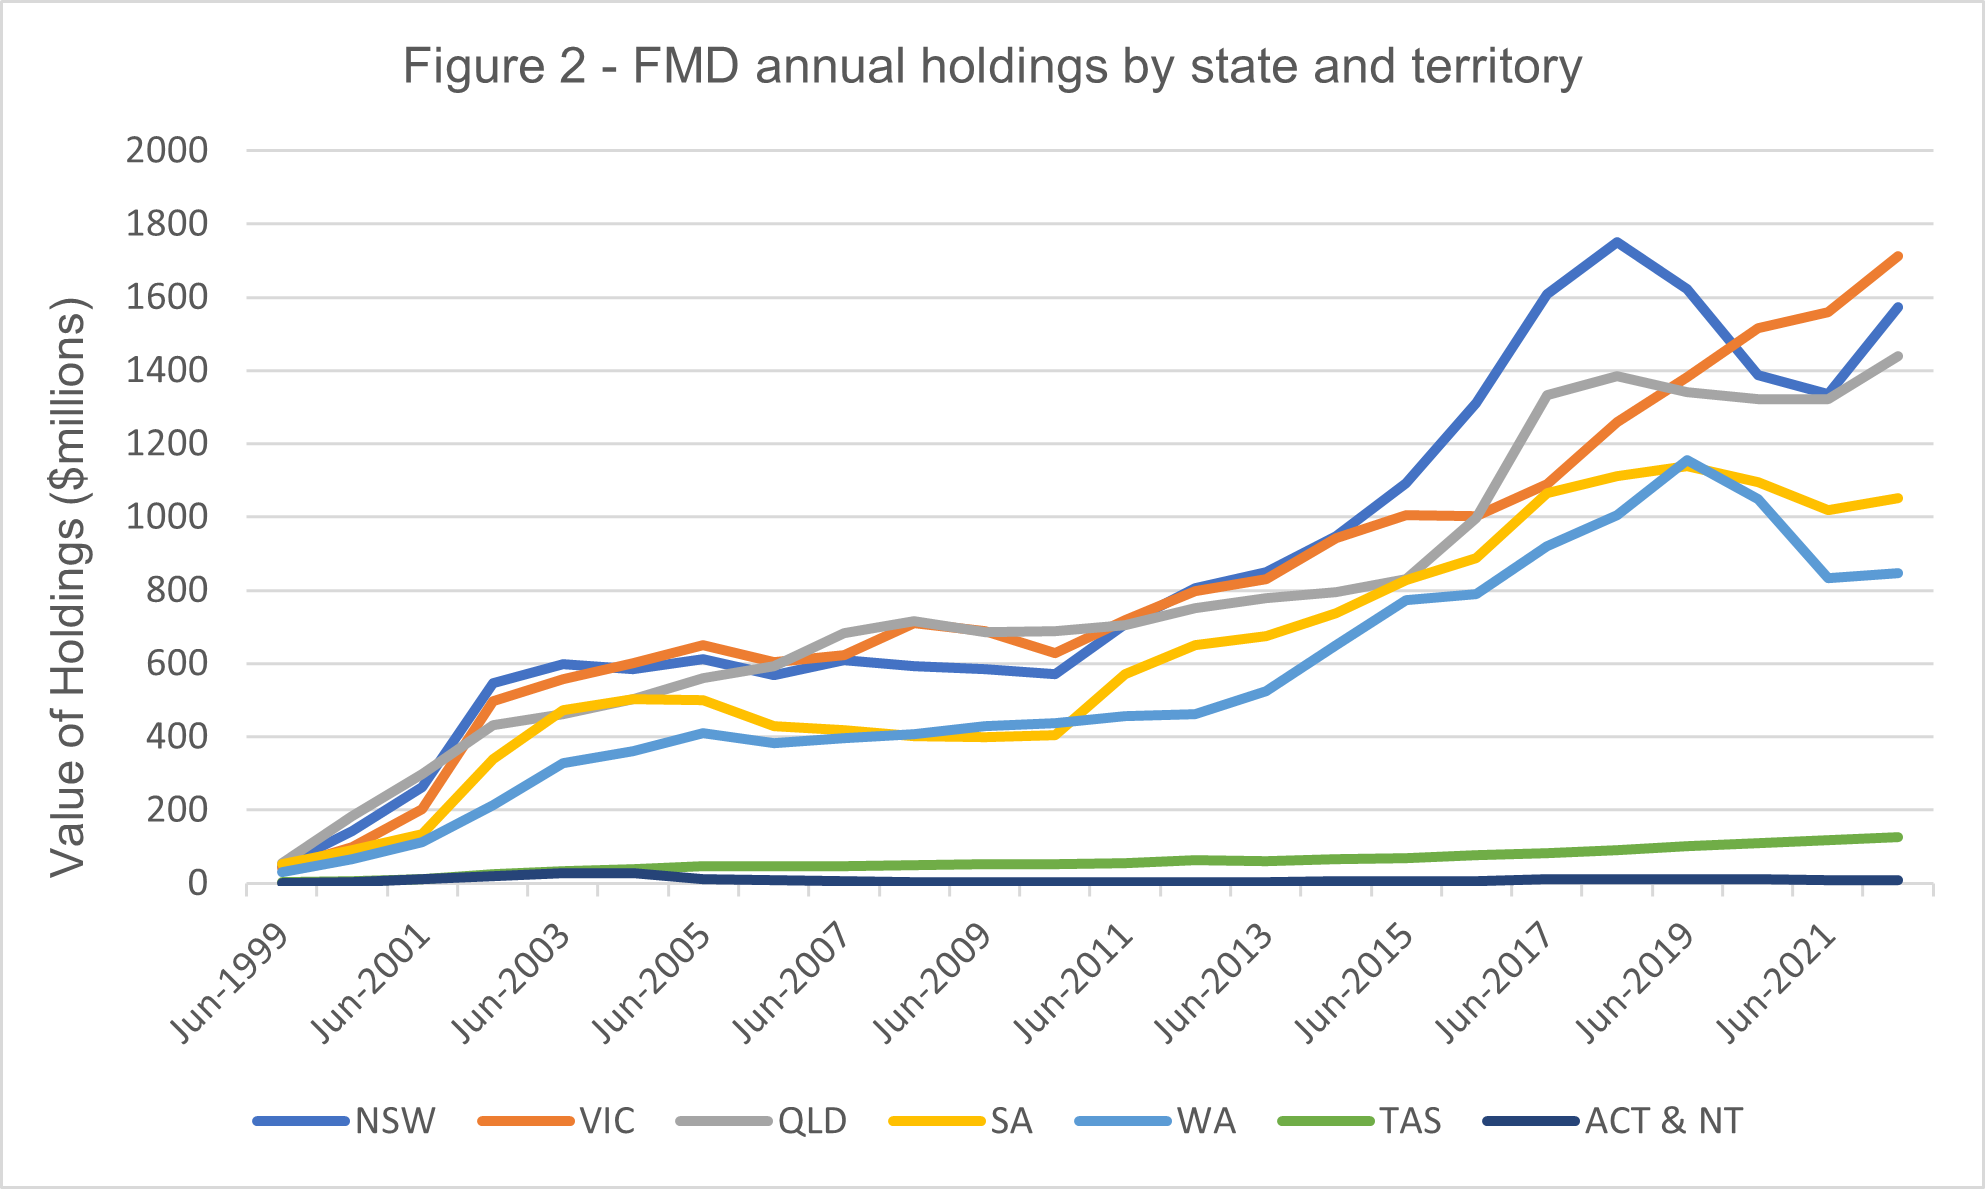
New South Wales, Western Australia, South Australia, and Queensland all experienced a drop in FMD holdings between 2019 to 2021 (Figure 2) with New South Wales and Queensland declines starting a year earlier than the other states in 2018. This corresponds with the onset of three consecutive years of drought and emphasizes the use of FMD’s to manage difficult conditions. Victoria and Tasmania bucked this trend, recording continued increases in FMD holdings over this period. The ongoing increase in FMD holdings for Victoria and Tasmania can be put down to their diverse agricultural industries. Horticulture, livestock and dairy industries all increased during this time (Figure 3). These industries make up a large proportion of Victoria and Tasmania's agriculture sector. Western Australia is yet to see a significant increase in FMD holdings after drawdowns began at the end of 2019 financial year. Since bottoming in 2021 they have only increased 2 per cent, despite what was then a production record for the winter crop in season 2021/22. This suggests that farmers in that state could be using alternative risk management tools. These could include capital upgrades, instant asset write-offs or off-farm investments.
Unveiling FMD Performance in Key Agricultural Industries
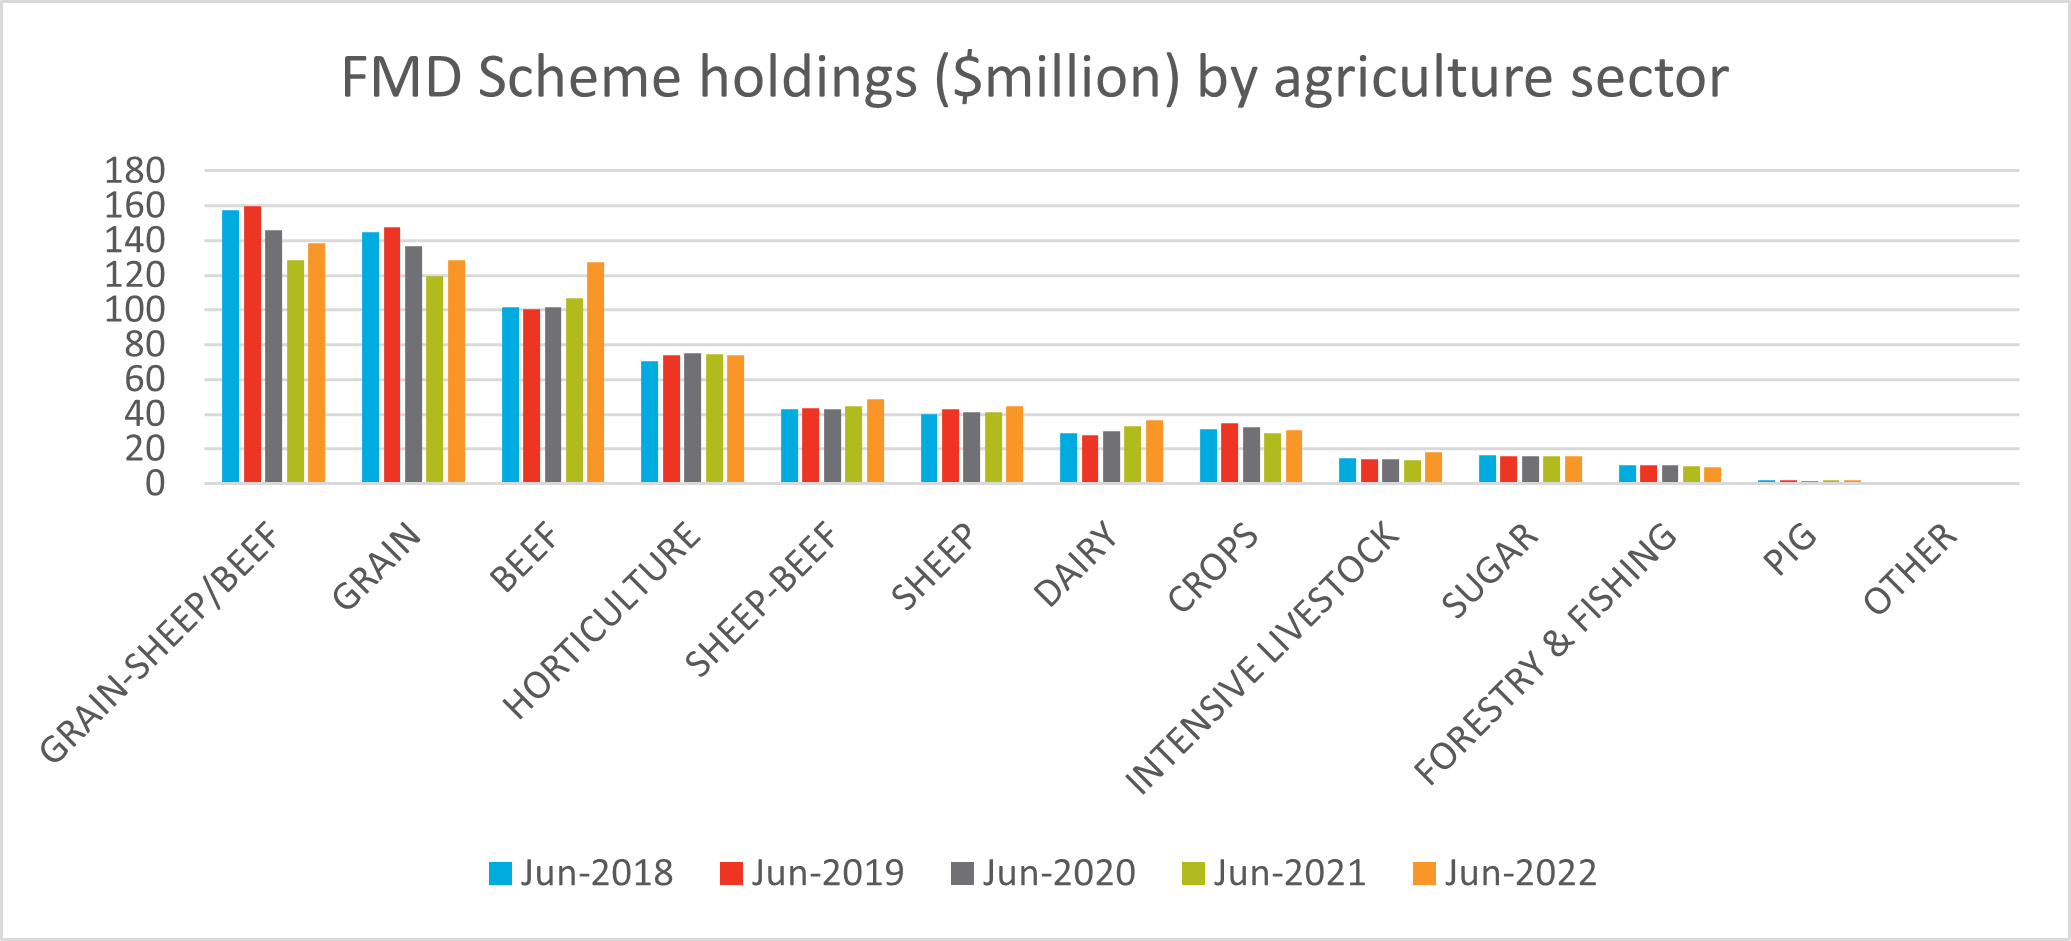
In 2022 the mixed grain-sheep/beef sector had the greatest industry share of the total value of FMD’s. This was followed by the beef and grain sectors on equal second. Broad acre farms (grain, sheep and beef) accounted for 72 per cent of the total value of FMD’s on 30 June 2022 (Figure 3). Looking at year on year growth all industries posted increases in FMD holdings except for forestry/fishing and horticulture, down 5 per cent and 1 per cent respectively. The intensive livestock industry showed the largest percentage gain with a 32 per cent increase from the previous year. The beef sector showed the second-best performance with the value of holdings in this sector increasing by 20 per cent. This caps off four consecutive years of growth in holdings by the beef sector with $26 million added over that time. After three consecutive years of drawdowns the grains industry bounced back with an eight per cent increase in holdings in June 2022. Following on from a record-breaking season that sector is likely to see holdings increase in 2023.
Conclusion
The Farm Management Deposit (FMD) scheme has proven to be a valuable tool for Australian farmers across different sectors. It has provided a safety net during low-income years, empowered farmers to manage risks and contributed to the long-term financial resilience of the agricultural industry. Moving forward, continued support and awareness of the FMD scheme will be vital in ensuring the prosperity of the agricultural community and its ability to adapt to future uncertainties.
Related Articles
-

Does farmland outperform other asset classes?
Farmland, residential housing or share markets - who is the strongest asset class of them all? -
How is seasonal labour supply shaping up in 2023
How has labour availability improved and which industries are still under strain. -

Whose plate will record lamb production end up on?
As the weather cools down and chops on the barbie get swapped for roasts in the oven, we take a look at whose plate lamb will end up on this year.