Insights September 2024

Insights September 2024
Climate and Carbon
- Know your greenhouse gas emissions value per unit of product, because your access to markets is likely to depend on it more after 1 Jan 2025.
- Climate driver projections may not be as useful in future as they have been.
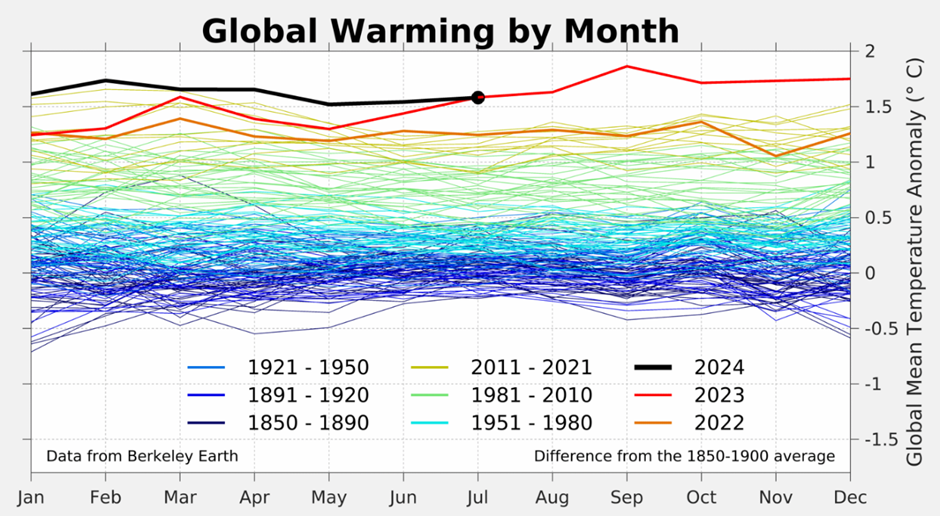
- Global SSTs were the warmest on record for each month between April 2023 and June 2024. July 2024 global SSTs were the second warmest on record, not as warm as July 2023 but much warmer than any other year. August 2024 is currently tracking as the second-warmest August on record.
- Above average maximum and minimum temperatures are very likely (greater than 80% chance) across most of Australia, according to the BoM.
Climate Risk and Resilience Reporting becoming Mandatory
Recently a bill to require climate reporting by Australia’s largest companies passed the Senate. The Bill is called the Treasury Laws Amendment (Financial Market Infrastructure and Other Measures) Bill 2024. It is likely to come into force on 1 January 2025.
It is also likely to affect most if not all businesses, including agricultural businesses.
The Bill requires companies to report their greenhouse gas emissions intensity, their resilience to climate change, and plans for emissions reductions. The objective is to better understand the risks and opportunities from climate change among investors so that capital is used wisely. It also is intended to ensure that businesses assess their risks and opportunities from climate change, so they become more resilient to the new climate conditions.
The first thing a farm might notice is that clients ask for the greenhouse gas emissions number per unit of valued product. It may have happened already. That is the first step on the journey. It requires understanding the sources of your emissions.
The requirement to develop an emissions reduction plan can be seen as more unprofitable reporting, as just red tape. A better way to see it is as a stimulus to incorporate climate considerations into your strategic planning process.
Climate change will impact every business including agriculture. From changes in productivity to changes in supply chains, and labour efficiency and operating conditions. It’s certainly more than a 1.5°C rise in daily temperatures.
The wise company will use the reporting process to identify ways to save or make money, not just spend it.
Know your number and make a plan to adapt to the new climate.
Climate Update
In the most recent Climate Driver Update, The Bureau of Meteorology (BoM) repeated its earlier view that the signs about spring weather are ambiguous and are not going in one direction.
The BoM said:
'Sea surface temperatures (SSTs) in the central equatorial Pacific Ocean are ENSO-neutral, having gradually cooled from El Niño levels since December 2023. This cooling is being sustained by deep waters surfacing in the central and eastern Pacific. However, the extent and magnitude of cool water has decreased since last fortnight. Atmospheric patterns, including cloud and trade winds, are currently ENSO-neutral.'
After discussing the changing sea surface temperatures, and what they could indicate, the BoM notes that roughly half of the models point towards more SST cooling while three are seemingly stable.
Previous experience is becoming a less reliable method of predicting future long-term weather. The BoM acknowledges this concept later in the Update where it says:
The current global pattern of warmth differs to historical patterns of SSTs associated with ENSO and IOD. This means future predictions of ENSO and IOD based on SSTs during past events may not be reliable. (our emphasis)
ENSO is of course the El Nino Southern Oscillation (more here) and IOD is the short form for Indian Ocean Dipole (more here).
This underscores the fundamental message around climate and climate change. Things are changing now and have been for some time. Often, we look at how weather varies from ‘normal’. Sometimes we look at how it varies from average. In both cases there is an assumption that the path of future weather will follow one of a few directions that it did previously. They may not.
Under climate change, we need to understand when climate drivers are in an unstable state or may not act predictably. That is a valuable guide as well.
Sea Surface Temperatures
The differential between heat in the tropical zone and the cold poles drives global weather.
Both the atmosphere and the oceans absorb heat energy. In both instances, the hot medium expands with the greater embedded energy it contains. This drives movement of air masses and water masses. The hot air rises until it meets a kind of ceiling in the atmosphere. It then moves towards the poles, where the air gets denser and sinks towards the earth’s surface.
The oceans are more complex. The ocean currents move under the force of the wind, but especially of hotter water pushing out towards colder water that is sinking. Ocean currents are the results of complex interactions of heat/cold and wind with the landforms and sea bottom. These currents cool more slowly. About 90% of the extra heat added to the earth system is absorbed by the ocean.
How the ocean currents transport heat, and the relative stability of the global circulation of water matters. More energy is being added to the ocean circulation due to climate change. The consequences will only be known after changes have occurred. It is not certain however that the circulation will work as effectively as in the past and cool us down.
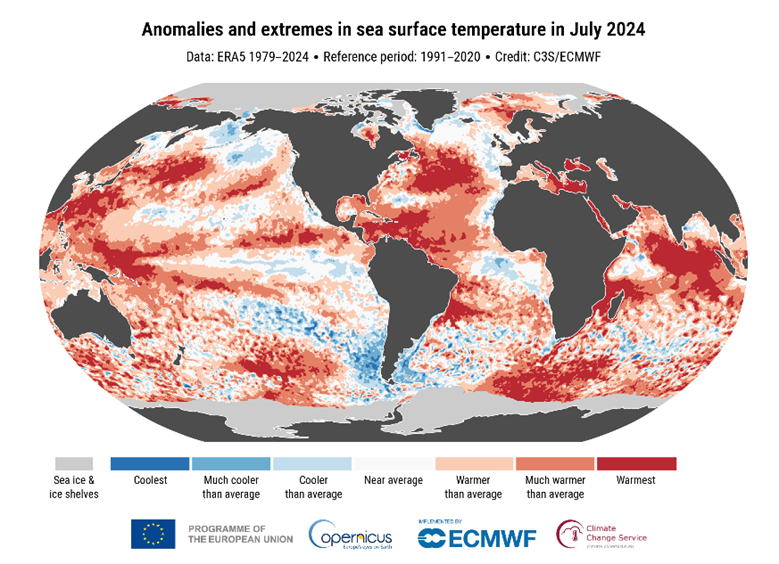
The global ocean temperatures have been above the long-term average for fifteen consecutive months. The Copernicus Climate Change Service/ECMWF provided the map of temperature variations for July (below). It noted that:
‘The sea surface temperature (SST) for July 2024 over 60°S–60°N was 20.88°C, the second-highest value on record for the month, and only 0.01°C below July 2023.’
It went on to conclude that:
‘This marks the end of a 15-month period when the SST had been the warmest in the ERA5 data record for the respective month of the year.’
It is technically correct to say it is the end of the run of record warm ocean temperatures. Nonetheless, it may not be appropriate.
The trend over several months showing a progressive reduction in the sea surface temperatures is a more reliable guide than one very modest reduction in temperatures.
The BoM took a more balanced view when it said:
‘Global SSTs were the warmest on record for each month between April 2023 and June 2024. July 2024 global SSTs were the second warmest on record, not as warm as July 2023 but much warmer than any other year. August 2024 is currently tracking as the second-warmest August on record. The current global pattern of warmth differs to historical patterns of SSTs associated with ENSO and IOD. This means future predictions of ENSO and IOD based on SSTs during past events may not be reliable.’
It is too early to say that impacts from record high ocean temperatures will start easing. The heat stored in the ocean will slow the cooling. We can say that the signs are tentative at best, and not a guide to action.

Air Temperatures
The January–July global surface temperature ranked warmest in the 175-year record at 1.28°C above the 20th century average of 13.8 °C.
The change in global average temperature at the earth’s surface matters for several reasons.

The primary reason is that it is used by governments as the indicator of progress or failure to progress on the objective in the Paris Accords to keep emissions low enough that the 1.5°C threshold is not passed. It is thought that this threshold ensures the global population minimises the amount of impact from climate change. It also minimises the costs of adapting to climate change and restoring the damage done. It provides a meaningful global guide to a threat generated by the global population.
Global temperatures do not change by the same amount in all regions.
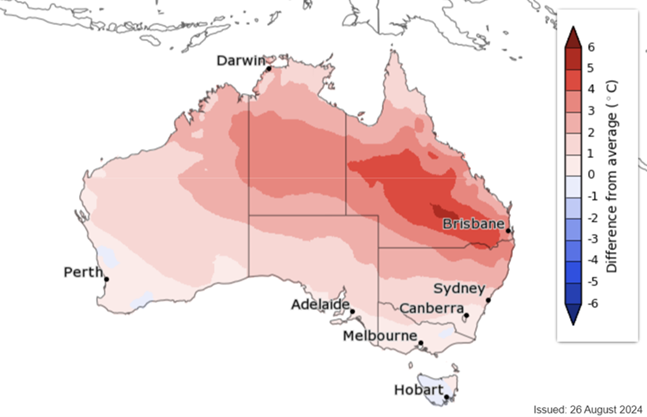
The BoM provided this prediction for air temperatures varying from 20th century averages during the three months September to November.

Source - Bureau of Meteorology
The BoM notes that during September to November it expects
- Above average maximum and minimum temperatures are very likely (greater than 80% chance) across most of Australia.
- There is an increased chance of unusually high maximum temperatures for most of Australia, particularly across the north and Tasmania.
- The risk of heatwaves increases as we approach the warmer months.

